
Using Visual Formula
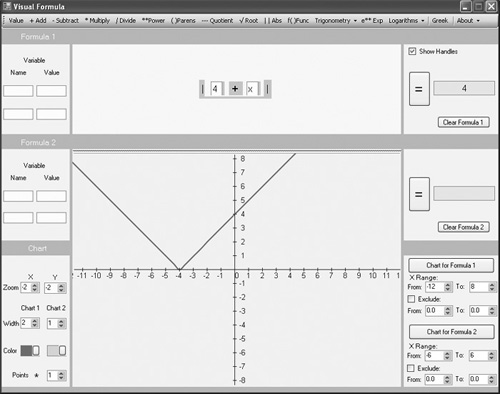
Use Visual Formula to implement a linear equation involving an absolute value. Toward this end, generate a graph that shifts the vertex of the graph to the left on the x axis 4 units. Here is the equation that accomplishes this task:
y = |4 + x|
To implement the equation, refer to Figure 7.11 and use the following steps:
Double click the menu item for absolute values (|| Abs). Then click in the equation composition area to position the absolute value bars. Use the mouse cursor to pull the bars for the absolute value area far enough apart to accommodate two value fields and a plus sign (see Figure 7.11).
Click the Value menu item. Position the field just to the right of the left absolute value bar. Click in the field and type 4.
Click the Add menu item and position the plus sign to the right of the Value field.
In the lower part of the Visual Formula window, move the cursor to the top of the Cartesian plane so that it turns into parallel bars. Pull the Cartesian plane up until it is even with the bottom of the top equation composition area.
In the lower-right panel find the From and To fields for the X Range setting beneath the Chart for Formula 1 button. Click the To control and set the value to −12. Click the From control and set the value to 8.
In the lower-left-panel, find the Zoom label. Click the controls for the X and Y fields for the Zoom label, and set both fields to −2.
In the Chart 1 area, set the Width field to 2.
Click the Chart for Formula 1 button. You see the graph shown in Figure 7.11.
Figure 7.11. Adding to the number inside the absolute value bars shifts the graph to the left.
To experiment, insert the following values in the field preceding the plus sign and observe the results: 2, 3, 5, 6. In each instance, the distance you shift the graph to the left on the x axis changes. To shift the graph so that its vertex moves to the right, use values of −2, −3, and −6. As you go, remember to click on the Chart for Formula 1 button to refresh the graph each time you change a value. Also, increase the value of the X Range To control to 12.