What Makes a Function Linear?
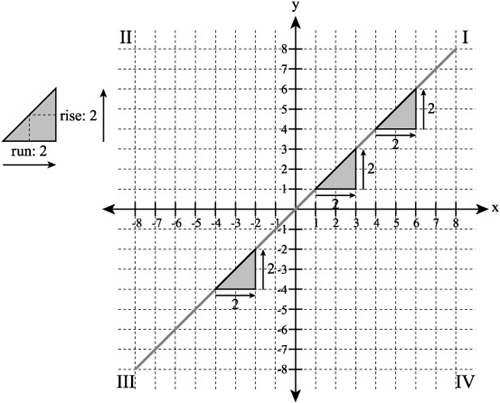
In the graphs presented in the previous sections, you worked with straight lines defined by different slope and y-intercept values. In each instance, the line you generated sloped upward into quadrant I or downward into quadrant IV, depending on whether you assigned a negative or positive value to the slope constant (m). The slope of a function is defined as the ratio between its rise and run. As Figure 6.6 illustrates, a key defining feature of functions identified as linear is that regardless of the position at which you examine a line you generate using a linear function, the ratio of the rise to the run remains the same.
Figure 6.6. The ratio of the rise to the run of a linear function does not change.
You can express the ratio of the rise to the run of a linear function using the capital letter delta (Δ) from ancient Greek:
![]()
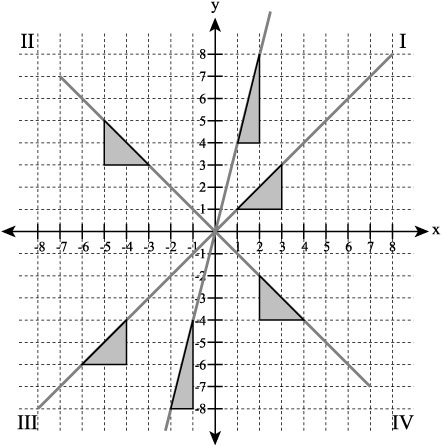
In Figure 6.6, to make it easier to view the ratio, you measure the rise and the run of the line with triangles with a height of 2 and a base of 2, but the slope (m) throughout remains 1. In other words, for each rise of 1 unit, the line runs by 1 unit. As Figure 6.7 illustrates, as long as the slope does not change, whether the slope is 1, –1, 4, or –4 makes no difference. The function remains linear.
Figure 6.7. The slopes of linear functions do not change.