
Absolute Values
The absolute value of a number corresponds to two values, one positive, the other negative. Because the graphs you create using absolute values depict both of these values, they are reflected across the y axis.
Here is an equation involving an absolute value that equates the absolute value of x with y:
y = |x|
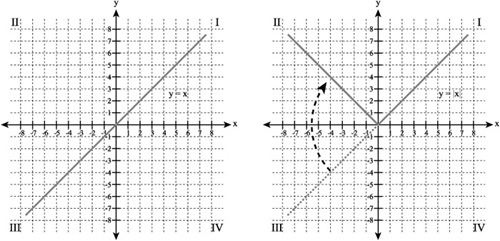
For each value on the y axis, you find corresponding negative and positive values of x. Figure 10.10 illustrates a graph of an equation that does not involve an absolute value (y = x). To the right of the graph of this equation, you see the graph of an equation that contains an absolute value. The darkened arrow emphasizes how the negative values of x generate positive y values. From this arises a typical V representation of a linear equation that involves an absolute value.
Figure 10.10. The effect of the absolute value is to make the values of y positive.
You can employ Visual Formula to implement a linear equation involving an absolute value. Use the following steps (refer to Figure 10.11):
Double-click the menu item for absolute values (Abs). Then click in the equation composition area to position the absolute value bars. Use the mouse cursor to pull the bars apart enough to accommodate a field.
Click menu item for Value, and then click in the equation composition area to place the Value field between the absolute value bars.
Type an x in the Value field. The x represents a range of values Visual Formula uses to generate a graph.
Now in the lower-right panel, click the Chart for Formula 1 button. (See Figure 10.12.) The graph of the absolute value function appears in the Cartesian plane.
Figure 10.11. Position the absolute value bars before you position the Value field.
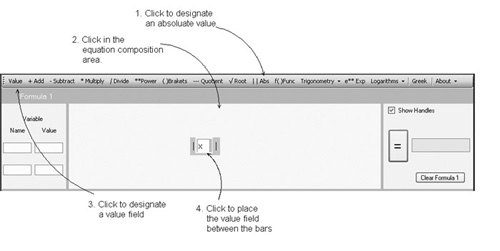
Figure 10.12. A linear equation containing an absolute value generates only positive y values.
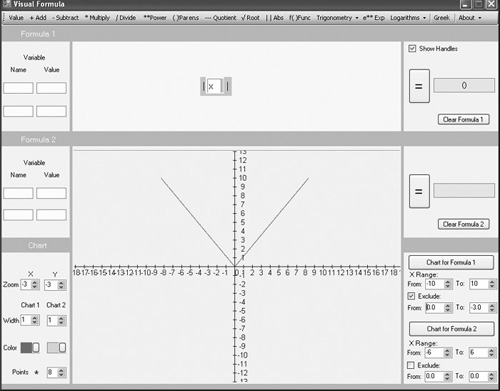
To adjust the lengths of the lines you see graphed, click the X Range number controls.