
Depicting Absolute Values
You can view a given absolute value as representing two values, one positive and one negative. Consider, for example, that you begin with an equation such as y = |x|. If you solve this equation for values ranging from 0 to 14, you end up with the graph Figure 7.4 illustrates. The values of x extend in positive and negative directions that reflect distances of the value from zero. The distances can be negative or positive.
Figure 7.4. The graph of an absolute value rises to the left and right of the y axis.
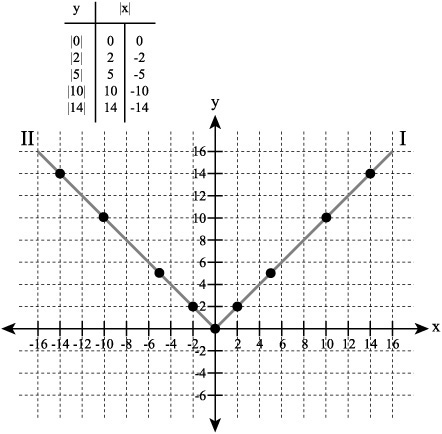
When you create a graph in which the points are at equal positions across a given line, they are symmetric with respect to the line. For example in Figure 7.4, the y axis is a line of symmetry for the two values you generate as you work with the absolute values of x. You can also refer to points you generate in this way as reflections of each other. As reflections, they are mirrored across the y axis.