
Using Visual Formula
You can use Visual Formula to explore a variety of trigonometric relationships. To view the trigonometric functions Visual Formula provides, click the Trigonometry menu item. You see a selection that includes the six basic trigonometric functions. To explore but one possibility, consider the notion that the value of the cosecant is the reciprocal of the value of the sine:
![]()
You can superimpose one graph on another using Visual Formula to see how this is so. You know, for example, that at any point at which the value of the sine equals 0, the value of the cosecant is undefined. In other words, it constitutes an infinitely large or infinitely small value that you cannot represent on a graph.
To employ Visual Formula to examine this relationship between the two trigonometric functions, refer to Figure 12.22 and follow these steps:
Click the Trigonometry menu item. You see a selection of six trigonometric functions. Select the sin (sine) item. Then click in the upper equation composition area to position the function.
Click the Value menu item. Then immediately to the right of the sin function box, click to position the Value field. Click in the box and type x.
3. Now move to the lower-right panel and locate the X Range fields. Click the control for the From field and set the value to −10. Click the control for the To field and set the value to 10. (You can also type the values −10 and 10.)
Now locate the Chart panel and set the Zoom values. Click the control for the X field and set it to −2. Click the control for the Y field and set it to −3.
Set the Width field to 2 for Chart 1.
Set the two Color fields to red and purple (or darker colors that you can readily distinguish).
Click the picker for the Points field and set the value to 8. The picker sets the number of points Visual Formula uses to plot graphs. For this operation, it is essential to set this value to 8.
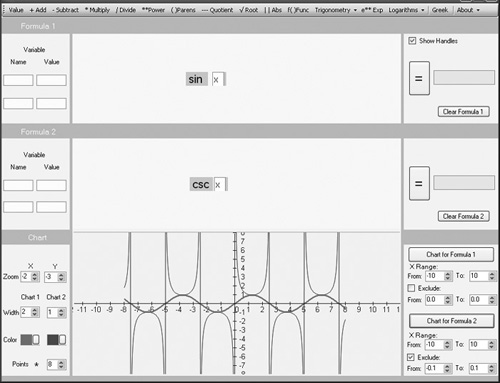
Now you proceed to chart the function that is the reciprocal of the sine function. This is the cosecant function. When you chart the cosecant function, the two graphs show you that when the value of the sine is 0, the value of the cosecant is undefined. Refer to Figure 12.22 and follow these steps:
Now move to the Visual Formula top menu and click the Trigonometry menu item. You see the six trigonometric functions. Click the csc item.
Click in the lower of the two equation composition areas to position the csc function.
Click the Value menu item. Then click immediately to the right of the csc function to position the Value field. Type an x in this field.
Now find the X Range fields that lie beneath the Chart for Formula 2 button. Set the From field to −10. Set the To field to 10.
Click the Exclude check box. In the From field, type −0.1. In the To field, type 0.1.
Click the Chart for Formula 2 button to generate the graph for the cosecant. The arms of the graph extend infinitely upward at points at which the sine values are 0.
After generating the graphs shown in Figure 12.22, generate other graphs using the same approach. Here are some primary relationships to explore:
