
Translation and Shift
You can alter functions that incorporate absolute values so that you move your graph along the x or y axis. This activity is known as translation. To see how this is so, consider again the equation used to generate a graph that is symmetrical to the y axis (see Figure 7.4):
f (x) = |x|
If you add a value to the absolute value of x, you can move the resulting graph up or down the y axis. A positive value moves it up. A negative value moves it down. To see how this is so, consider an equation that involves translating the graph up by 4:
y = 4 + |x|
Even if x is a negative value, the absolute value sign makes it positive. For this reason, adding 4 to the value of x always increases the corresponding y value by 4. As Figure 7.5 illustrates, on both the positive and negative sides of the y axis, then, the slope of the line remains consistent but is shifted upward. Both lines are translated in a consistent, symmetrical way.
Figure 7.5. Translation preserves the symmetry of the graph across the y axis.

As Figure 7.5 reveals, adding a value to the absolute value of x, you translate coordinates vertically upward. On the other hand, if the value you add is negative, the translation moves the line downward.
Horizontal translation differs from vertical translation because the addition or subtraction you perform is within the absolute value signs. You are changing the value of x, as such, before you determine its absolute value. The effect of such an addition is that you move along the x axis to the right if you subtract a value. You move to the left if you add a value.
This equation shifts the graph to the left:
y = |x + 4|
This equation shifts the graph to the right:
y = |x − 4|
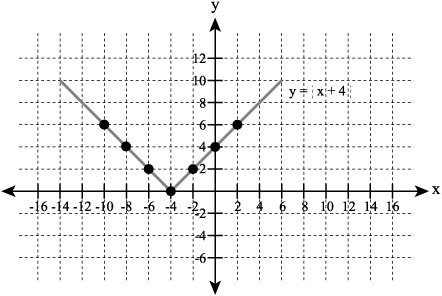
For Figure 7.6, you replace x with the expression x + 4. This activity moves to graph to the left.
Figure 7.6. The expression | x + 4 | translates the graphs to the left.
Exercise Set 7.5Graph the results of the following equations. |
Slopes
If you change the slopes of functions that involve absolute values, you still preserve the symmetry of the lines that result. Consider, for example, the effect of altering the value of the slope from ![]() to 2. Here are the resulting functions:
to 2. Here are the resulting functions:
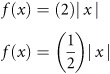
For the first equation, when you set the slope to 2, for every 1 unit of run, you generate 2 units of rise. On the other hand, when the slope is ![]() for every 1 unit of run, you generate only half a unit of rise. When you explore these slopes with respect to absolute values, then the lines illustrated by Figure 7.7 result.
for every 1 unit of run, you generate only half a unit of rise. When you explore these slopes with respect to absolute values, then the lines illustrated by Figure 7.7 result.
Figure 7.7. Slopes sustain symmetry.

More on Symmetry
When you work with functions that involve absolute values, the slopes of lines allow them to be symmetric relative to either the y axis or some other line. Such a line is known as the line of reflection. As is evident from the discussion of lines generated with absolute values, you can create a set of such lines such that each point on one line corresponds to a point on another line. When you create such sets of lines, you can mirror them horizontally, vertically, or at other angles. If you mirror them horizontally, they are symmetric with respect to the x axis. If you mirror them vertically, the are symmetric with respect to the y axis.
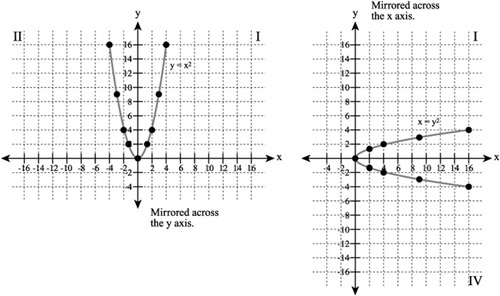
A parabola provides a mirrored graph that you create with an equation that is not linear. A parabola provides a graphical form that you can manipulate in largely the same ways that you manipulate the mirrored lines of an equation containing absolute values. Here are equations that create parabolas mirrored across the y and x axes:
| x2 = y | Generates a line mirrored across the y axis. |
| y2 = x | Generates a line mirrored across the x axis. |
Figure 7.8 illustrates lines you can generate from these two equations.
Note
A parabola that is symmetrical to the x axis is not properly a function if you apply the horizontal line rule.
Alternate Forms of Symmetry
The use of an even-numbered exponent in the previous section resulted in parabolas that are symmetrical across an axis. Yet another form of symmetry occurs when you use an odd-numbered exponent. In this case, the graph that results is symmetrical to a given point. The origin of the Cartesian plane lies at point (0,0). You can draw many geometrical figures that are symmetrical to this point. Drawn symmetrical to this point, a line is said to be symmetrical to the origin.
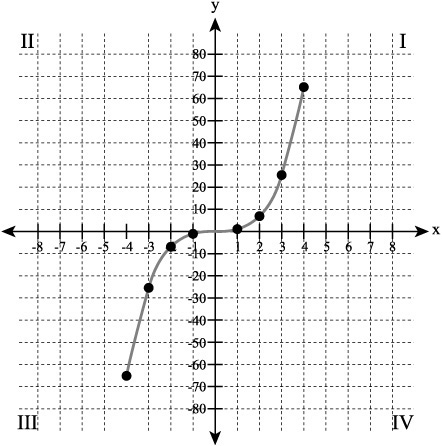
Figure 7.9 illustrates a line generated using the cube of x, (x3). The line slopes down from quadrant I, across the origin, and into quadrant III. The points you map in the two quadrants mirror each other, but the coordinate pairs in quadrant III contain negative x and y values while those in quadrant I do not. The resulting graph is symmetrical with respect to the origin.
Figure 7.9. A cube generates a line symmetrical to the origin.
Exercise Set 7.6Plot coordinate pairs for these equations and determine whether they are symmetrical to the x axis, the y axis, or a point.
|