
Even and Odd Exponential Values
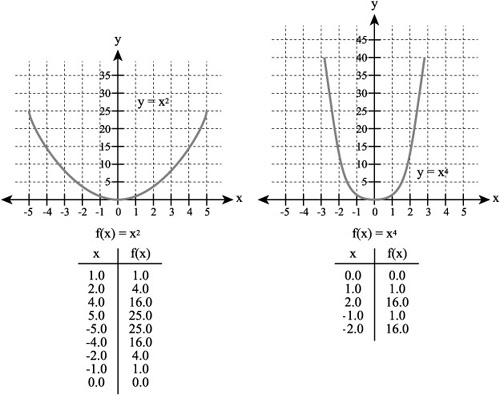
Plotting the values for the cube of x introduces a notion that proves essential to working with the graphs of exponents. As Figure 10.16 illustrates, in situations where the exponent for the number is even, you see graphs that open upward. Such graphs are symmetrical with respect to the y axis.
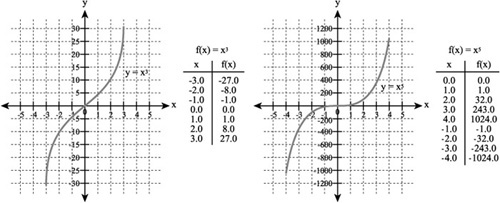
In contrast, in situations where the exponent of the variable is odd, then only one arm of the graph extends upward. As Figure 10.17 shows, the graph that results is symmetrical with respect to the origin of the Cartesian coordinate plane.
Figure 10.17. Odd exponents used with negative numbers result in graphs that are symmetrical with respect to the origin.
You can use Visual Formula to implement two equations at a time and, in this way, compare the actions of even and odd exponents and negative base values.
Refer to Figure 10.18, and use these steps:
Create an equation with an even exponent and a negative base value. Click the Parens menu item. Then click in the equation composition area to position the parentheses. Pull the parentheses apart far enough to accommodate a field for a value.
Click the Subtract menu item. Then click inside the parens in the equation composition area to create a minus sign (–). Move the minus sign snugly against the left parenthesis.
Click on the Value item in the menu. In the equation composition area just after the minus sign, click to place the Value field inside the parens. In this field, type x.
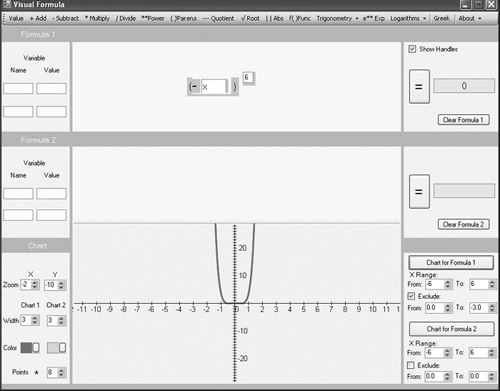
Click on the menu item for Power (or exponent). Then place the field for the exponent to the upper right of the closing parenthesis. Type a 6 in the Exponent field.
Now in the lower-right panel, click on the Chart for Formula 1 button. The graph shown in Figure 10.18 appears in the Cartesian plane.
To thicken the line for the graph so that it appears as shown in Figure 10.18, click on the Chart 1 Width field in the Chart panel. You can also use the Color palette to select a darker color.
Figure 10.18. A graph of negative values raised to an even power is symmetrical to the y axis.
Now add a second equation that generates a graph using an odd exponent. When you use a negative sign with the base value in an equation that contains an odd exponent, the upper arm of the graph extends up into quadrant II, while the lower arm extends down into quadrant IV. To see how this is so, refer to Figure 10.19 and use the following steps:
If you have not done so, position the mouse cursor on the top edge of the Cartesian plane. When it becomes a horizontal bar with arrows extending up and down, pull the Cartesian plane down so that the lower equation composition area is exposed.
Click the Subtract menu item. Then click inside the parens in the equation composition area to create a minus sign (–). Move the minus sign so that it rests against the left parenthesis.
Click on the Value item in the menu. In the equation composition after the minus sign, click to place the Value field. In this field, type x.
Now click on the menu item for Power, and place a field for the exponent to the upper right of the closing parenthesis. Type a 7 in the Exponent field.
Now in the lower-right panel, click on the Chart for Formula 2 button. As Figure 10.19 reveals, you now see a second graph in the Cartesian plane. Unlike the first, this graph is symmetrical with respect to the origin of the Cartesian plane. Its course is from quadrant II to quadrant IV.
Figure 10.19. The exponent with an odd number generates a graph symmetrical to the origin of the Cartesian plane.
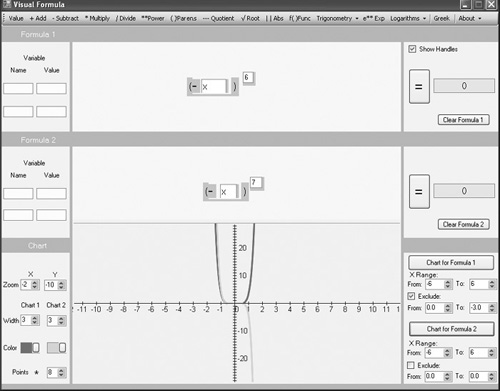
To thicken the lines for the graphs so that they appear as shown in Figure 10.19, click on the Width controls in the Chart panel. To change the color, select a color from the Color palette.
In Figure 10.19, the shape of the graph the negative values generate is the reverse of what you see if you do not make the base value negative. To see how this is so, remove the minus sign from the lower of the two equations. To remove the minus sign, hold down the Shift key and click on the minus sign. This action deletes it.
Then click the Chart for Formula 2 button. The effect is that the odd graph travels from quadrant I to quadrant III instead of from quadrant II to quadrant IV.