Using Visual Formula
Use Visual Formula to implement a quadratic equation. Then use this equation to test different values for quadratic. Set up the quadratic equation using the standard form of a quadratic equation:
f (x) = ax2 + bx + c
Here is an equation you can use for practical purposes of implementation:
f (x) = 3x2 + 3x – 1
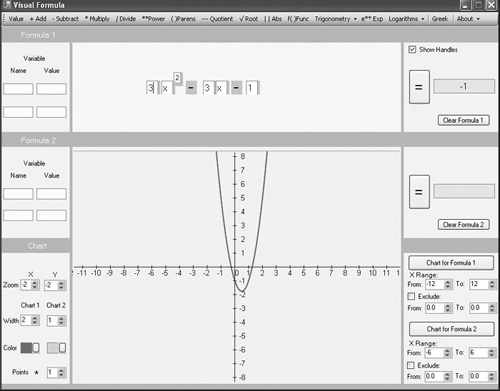
To implement this equation, use the upper equation composition area. Refer to Figure 9.14 and follow these steps:
Click the Value menu item five times in succession and, with each click, position a field in the upper equation composition area. Position the first two fields in close proximity to each other, skip enough space to allow for a field and an operator, and then position the third and fourth fields in close proximity. Leave enough space for an operator, and then position the last field.
In the first and third fields type 3. In the second and fourth fields type x. In the last field type 1.
Move the fields apart from each other so that they correspond roughly to the fields shown in Figure 9.14. You will need more room between some of the fields than others. Make enough room so that the fields you place in the next few steps do not overlap. Recall that if you make a mistake, press the Shift key and left click on a field to delete it.
Click the Power menu item and to the right and just above the second x field position the exponent. The default value is 2. Do not change this value.
Click the Subtract menu twice in succession. With the first click, position the minus sign after the exponent field and level with the x field. With the second click, position the minus sign before the final x field.
Click on the equal button to the right of the equation composition area.
Position the cursor on the top of the Cartesian plane. When it turns into parallel bars, pull the Cartesian plane up to the bottom of the equation composition area.
Now proceed to the lower-right panel. Beneath the Chart for Formula 1 button, set the X Range From control to –12. Set the X Range To control to 12.
In the lower-left Chart panel, set the Zoom X and Y fields to –2.
Set the Width field for Chart 1 to 2.
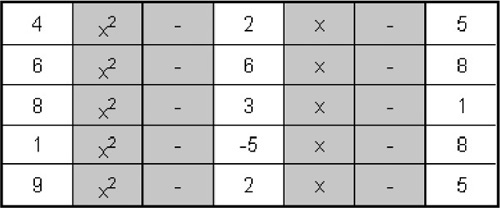
To view changes in the behavior of your equation, change its values. Before working with these values, in the Chart panel, click the controls for the X and Y Zoom fields and set the values for both fields to –4. Then work through these values and see how the parabola changes: