Plotting Secant Values
The value of the secant is undefined when it falls on a vertical line passing through a point on the x axis at which the cosine value is 0. The cosine and secant functions are reciprocals of each other.
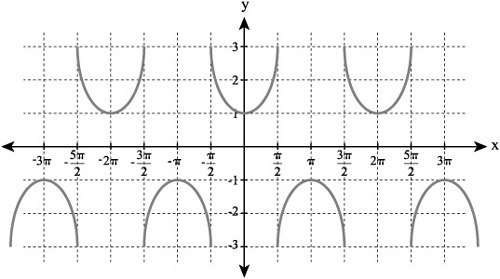
When you plot a secant value, if you begin on the x axis at 0, the value of the secant is 1. As you move toward ![]() from 0, the value of the secant rises on an asymptotic basis. In other words, it approaches
from 0, the value of the secant rises on an asymptotic basis. In other words, it approaches ![]() but never reaches it, and its value becomes infinitely large.
but never reaches it, and its value becomes infinitely large.
After passing ![]() , you are in the next phase of the secant. At this point, the secant values shift to below the x axis. They start at an infinitely negative value, and then increase in the range that is greater than
, you are in the next phase of the secant. At this point, the secant values shift to below the x axis. They start at an infinitely negative value, and then increase in the range that is greater than ![]() . The increase continues until you reach π. At π the value of the secant is −1. Then values begin to infinitely decrease as they near
. The increase continues until you reach π. At π the value of the secant is −1. Then values begin to infinitely decrease as they near ![]() . To complete the period, the secant values shift to above the x axis.
. To complete the period, the secant values shift to above the x axis.
They begin infinitely large ![]() at and then decrease as they near 2π. At 2π the secant value is 1.
at and then decrease as they near 2π. At 2π the secant value is 1.
The secant values create a periodic pattern that alternates above and below the x axis, and the period of the secant graph is 2π. In Figure 12.20, for example, you can identify a period as beginning at 0 and extending to 2π.