Graphs of Inverses
When you work with inverse values, such as ![]() , you create a graph that is undefined at x = 0. The domain of such graphs consists of all real numbers except 0. Zero is excluded because division by 0 is not defined. For this reason, when you use Visual Formula to generate a graphical representation of inverse values, you must use the Exclude option to prevent calculations that might involve using 0 as the divisor.
, you create a graph that is undefined at x = 0. The domain of such graphs consists of all real numbers except 0. Zero is excluded because division by 0 is not defined. For this reason, when you use Visual Formula to generate a graphical representation of inverse values, you must use the Exclude option to prevent calculations that might involve using 0 as the divisor.
Note
Visual Formula issues a warning if you set up an equation that allows you to divide by 0. To adjust for this situation, use the Exclude option to restrict the range of values you allow for the calculation.
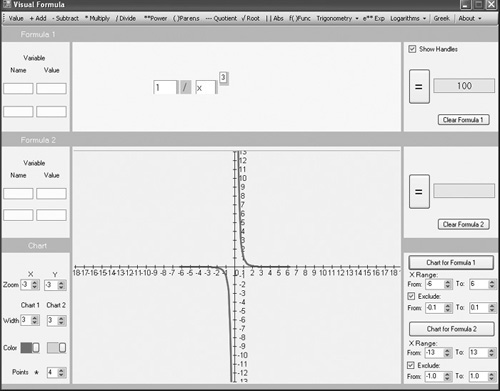
To employ Visual Formula to implement an equation that generates values that are the inverses of the domain values, use the following steps (refer to Figure 10.21):
Click the menu item for Value. Then click in the equation composition area to position a Value field. Type a 1 in the Value field.
Click the Divide menu item. Then click to the right of the Value field to position the division sign.
Again, click on the Value menu item. Place a Value field immediately after the division sign. Type an x in the Value field.
Now proceed to the lower-right panel and find the Exclude controls. As mentioned previously, you must exclude 0 from the values that are used in the calculations of the inverse of the domain values. To exclude 0, designate the range of values to exclude. To exclude a range that includes only –0.1 to 0.1, manually type –0.3 in the From field or use the control arrows. Then manually type 0.1 in the To field or use the control arrows.
Verify that the Exclude option is checked. If it is not checked, check it.
In the Chart panel, set the Zoom values to –3 and the Width values to 3. Set the Points value to 8.
Click the Chart for Formula 1 button to generate the graph. Figure 10.21 illustrates the graph of inverse values that results.
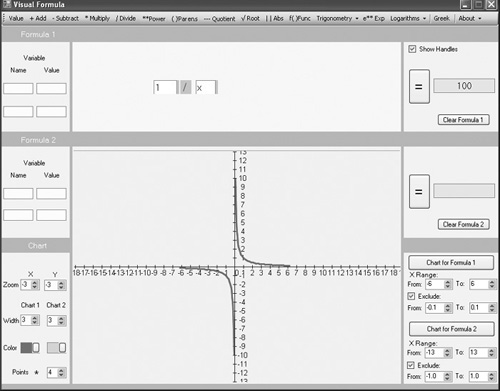
For the inverses of domain values you define using exponents, the appearance of the graph that results depends on whether the exponent is even or odd. Figure 10.22 illustrates the graph of the inverse of a square. The domain values are all greater than 0 and symmetrical with respect to the y axis.
Figure 10.22. Range values using the inverse of a square are greater than zero.

To implement the equation shown in Figure 10.22, begin with the equation you create for Figure 10.21. Click the Power menu item. To position the exponent, click to the upper right of the x field. Then type 2 in the exponent field. Click the Chart for Formula 1 button to refresh the graph.
Inverse squares generate graphs that are symmetrical to the y axis. Inverses of all domain values with even-numbered exponents are likewise symmetrical with respect to the y axis. With odd-numbered exponents, the situation changes. The graph that results is symmetrical with respect to the origin of the Cartesian plane. Figure 10.23 illustrates how this is so. As with other graphs of inverse values, these also exclude 0.
Figure 10.23. Inverse values with numbered exponents generate graphs that are symmetrical with respect to the origin.