
Plotting Sine Values
Figure 12.15 illustrates what happens if you calculate the sine values of the angles depicted in Figure 12.14. To make it so that the graph provides a fuller representation of the way that the values fluctuate from positive to negative, the range has been extended beyond that of a single rotation of a circle. The extension of the range does not affect the overall pattern.
Figure 12.15. When you plot sine values, you create a periodic pattern that fluctuates evenly from 1 to −1 on the y axis.
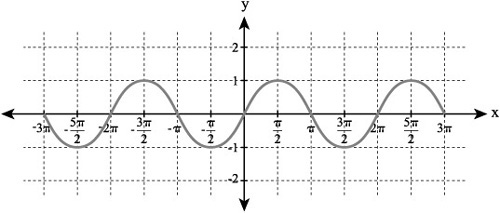
The overall pattern assumes a value of 0 at the origin—which represents an angle of 0. If you move to the right, allowing the x axis to map the increase of the value of the angles, the resulting sine values using the y coordinate increase to 1. This occurs when you reach the x value of ![]() . As you move past
. As you move past ![]() , the value of the sine decreases, reaching 0 when you are at π on the x axis. As you move past π, the value of the sine drops into the negative range. When you reach
, the value of the sine decreases, reaching 0 when you are at π on the x axis. As you move past π, the value of the sine drops into the negative range. When you reach ![]() , the value on the y axis is −1. This represents the lowest point. After that, the value begins to rise, and at 2π you are back at 0. The name usually applied to this pattern is sinusoidal. It is a periodic pattern that evenly fluctuates from 1 to −1 for each distance of 2π represented by the x axis.
, the value on the y axis is −1. This represents the lowest point. After that, the value begins to rise, and at 2π you are back at 0. The name usually applied to this pattern is sinusoidal. It is a periodic pattern that evenly fluctuates from 1 to −1 for each distance of 2π represented by the x axis.