
Plotting Cosine Values
As Figure 12.17 illustrates, when you plot cosine values using a Cartesian plane, plot angle values on the x axis, and move to the right to show increasing values of angles, the resulting y coordinate value is 1 when the angle of your circle is 0. When you reach ![]() (90°), the value of the y coordinate value drops to 0. From there, as you move past
(90°), the value of the y coordinate value drops to 0. From there, as you move past ![]() , the value of the cosine decreases, reaching −1 when you are at π. As you move past π, the value of the cosine begins to increase, reaching 0 again at
, the value of the cosine decreases, reaching −1 when you are at π. As you move past π, the value of the cosine begins to increase, reaching 0 again at ![]() . After that, the value begins to rise, and at 2π you are back at 1.
. After that, the value begins to rise, and at 2π you are back at 1.
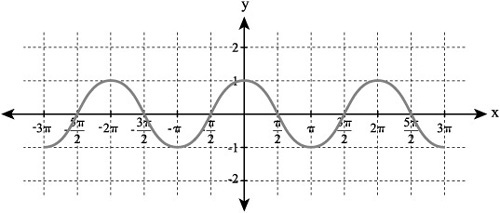
The same pattern characterizes movement in the negative direction along the x axis. As Figure 12.17 illustrates, at −![]() , the value of the cosine falls to 0. From there, it proceeds further downward to −1 at −π. As you move to −
, the value of the cosine falls to 0. From there, it proceeds further downward to −1 at −π. As you move to −![]() , the values of the cosine increase, and at −2π you are back to 1.
, the values of the cosine increase, and at −2π you are back to 1.