
In x64dbg, you can set a software breakpoint by navigating to the address where you want the program to pause and pressing the F2 key (or right-clicking and selecting Breakpoint | Toggle). To set a hardware breakpoint, right-click on the location where you want to set the breakpoint and select Breakpoint | Set Hardware on Execution.
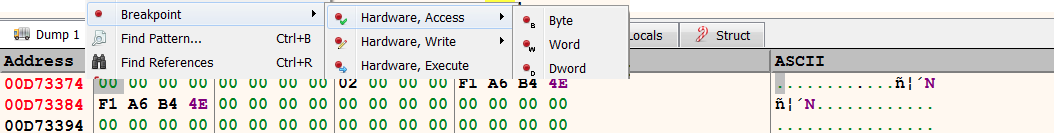
You can also use hardware breakpoints to break on write or break on read/write (access) to a memory location. To set a hardware breakpoint on memory access, in the dump pane, right-click on the desired address and select Breakpoint | Hardware, Access, and then choose the appropriate data type (such as byte, word, dword, or qword), as shown in the following screenshot. In the same manner, you can set the hardware breakpoint on memory write by choosing the Breakpoint | Hardware, Write option:
In addition to hardware memory breakpoints, you can also set memory breakpoints in the same manner. To do that, in the dump pane, right-click on the desired address and select Breakpoint | Memory, Access (for memory access) or Breakpoint | Memory, Write (for memory write).
To view all of the active breakpoints, just click on the Breakpoints tab; this will list all of the software, hardware, and memory breakpoints in the Breakpoints window. You can also right-click on any instruction inside the Breakpoints window and remove a single breakpoint, or all of the breakpoints.