
Throughout this book, you have seen examples of malware using DLL to implement the malicious functionality. Therefore, in addition to investigating processes, you may also want to examine the list of loaded libraries. To list the loaded modules (executable and DLLs), you can use Volatility's dlllist plugin. The dlllist plugin also displays the full path associated with a process. Let's take an example of the malware named Ghost RAT. It implements the malicious functionality as the Service DLL, and as a result, the malicious DLL gets loaded by the svchost.exe process (for more information on Service DLL, refer to the Service section in Chapter 7, Malware Functionalities and Persistence). The following is the output from the dlllist, where you can see a suspicious module with a non-standard extension (.ddf) loaded by the svchost.exe process (pid 800). The first column, Base, specifies the base address, that is, the address in the memory where the module is loaded:
$ python vol.py -f ghost.vmem --profile=Win7SP1x86 dlllist -p 880
Volatility Foundation Volatility Framework 2.6
******************************************************************
svchost.exe pid: 880
Command line : C:Windowssystem32svchost.exe -k netsvcs

Base       Size     LoadCount Path
---------- -------- --------- --------------------------------
0x00f30000 0x8000   0xffff    C:Windowssystem32svchost.exe
0x76f60000 0x13c000 0xffff    C:WindowsSYSTEM32
tdll.dll
0x75530000 0xd4000  0xffff    C:Windowssystem32kernel32.dll
0x75160000 0x4a000  0xffff    C:Windowssystem32KERNELBASE.dll
0x75480000 0xac000  0xffff    C:Windowssystem32msvcrt.dll
0x77170000 0x19000  0xffff    C:WindowsSYSTEM32sechost.dll
0x76700000 0x15c000 0x62      C:Windowssystem32ole32.dll
0x76c30000 0x4e000  0x19c     C:Windowssystem32GDI32.dll
0x770a0000 0xc9000  0x1cd     C:Windowssystem32USER32.dll
[REMOVED]
0x74fe0000 0x4b000  0xffff    C:Windowssystem32apphelp.dll
0x6bbb0000 0xf000   0x1       c:windowssystem32appinfo.dll
0x10000000 0x26000  0x1       c:users	estapplication dataacdsystemsacdseeimageik.ddf
0x71200000 0x32000  0x3       C:Windowssystem32WINMM.dll
The dlllist plugin gets the information about the loaded modules from a structure named the Process Environment Block (PEB). If you recall from Chapter 8, Code Injection and Hooking, when covering the process memory components, I mentioned that the PEB structure resides in the process memory (in the user space). The PEB contains metadata information about where the process executable is loaded, its full path on the disk, and information about the loaded modules (executable and DLLs). The dlllist plugin finds the PEB structure of each process and gets the preceding information. Then, the question is, how do you find the PEB structure? The _EPROCESS structure has a field named Peb that contains the pointer to the PEB. What this means is that once the plugin finds the _EPROCESS structure, it can find the PEB. A point to remember is that _EPROCESS resides in the kernel memory (kernel space), whereas the PEB resides in the process memory (user-space).
To get the address of the PEB in a debugger, you can use the !process extension command, which shows the address of the _EPROCESS structure. It also specifies the address of the PEB. From the following output, you can see that the PEB of the explorer.exe process is at address 7ffd3000 in its process memory, and its _EPROCESS structure is at 0x877ced28 (in its kernel memory):
kd> !process 0 0
**** NT ACTIVE PROCESS DUMP ****
.........
PROCESS 877cb4a8 SessionId: 1 Cid: 05f0 Peb: 7ffdd000 ParentCid: 0360
    DirBase: beb47300 ObjectTable: 99e54a08 HandleCount: 70.
    Image: dwm.exe
PROCESS 877ced28 SessionId: 1 Cid: 0600 Peb: 7ffd3000 ParentCid: 05e8
    DirBase: beb47320 ObjectTable: 99ee5890 HandleCount: 766.
    Image: explorer.exe
Another method to determine the address of the PEB is to use the display type (dt) command. You can find the address of the PEB of the explorer.exe process by examining the Peb field in its EPROCESS structure, as follows:
kd> dt nt!_EPROCESS 877ced28
   [REMOVED]
   +0x168 Session : 0x8f44e000 Void
   +0x16c ImageFileName : [15] "explorer.exe"
   [REMOVED]
   +0x1a8 Peb : 0x7ffd3000 _PEB
   +0x1ac PrefetchTrace : _EX_FAST_REF
You now know how to find the PEB, so now, let's try to understand what kind of information PEB contains. To get the human-readable summary of the PEB for a given process, first, you need to switch to the context of the process whose PEB you want to examine. This can be done using the .process extension command. This command accepts the address of the _EPROCESS structure. The following command sets the current process context to the explorer.exe process:
kd> .process 877ced28
Implicit process is now 877ced28
You can then use the !peb extension command followed by the address of the PEB. In the following output, some of the information is truncated for the sake of brevity. The ImageBaseAddress field specifies the address where the process executable (explorer.exe) is loaded in the memory. The PEB also contains another structure called the Ldr structure (of type _PEB_LDR_DATA), which maintains three doubly linked lists, which are InLoadOrderModuleList, InMemoryOrderModuleList, and InInitializationOrderModuleList. Each of these three doubly linked lists contains information regarding the modules (process executable and DLLs). It is possible to get information regarding the modules by walking any of these doubly linked lists. InLoadOrderModuleList organizes modules in the order in which they are loaded, InMemoryOrderModuleList organizes modules in the order in which they reside in the process memory, and InInitializationOrderModuleList organizes modules in the order in which their DllMain function was executed:
kd> !peb 0x7ffd3000
PEB at 7ffd3000
    InheritedAddressSpace: No
    ReadImageFileExecOptions: No
    BeingDebugged: No
    ImageBaseAddress: 000b0000
    Ldr 77dc8880
    Ldr.Initialized: Yes
    Ldr.InInitializationOrderModuleList: 00531f98 . 03d3b558
    Ldr.InLoadOrderModuleList: 00531f08 . 03d3b548
    Ldr.InMemoryOrderModuleList: 00531f10 . 03d3b550
    [REMOVED]
In other words, all the three PEB lists contain information about the loaded modules such as the base address, size, the full path associated with the module, and so on. An important point to remember is that InInitializationOrderModuleList will not contain the information about the process executable because the executable, is initialized differently as compared to the DLLs.
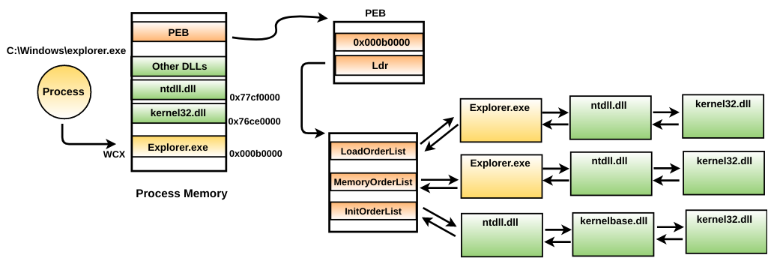
To help you understand better, the following diagram uses Explorer.exe as an example (the concept is similar to other processes as well). When Explorer.exe is executed, its process executable is loaded into the process memory at some address (let's say 0xb0000) with PAGE_EXECUTE_WRITECOPY (WCX) protection. The associated DLLs are also loaded into the process memory. The process memory also includes the PEB structure which contains metadata information of where the explorer.exe is loaded (base address) in the memory. The Ldr structure in the PEB maintains three doubly linked lists; each element is a structure (of type _LDR_DATA_TABLE_ENTRY) that contains information (base address, full path, and so on) about the loaded modules. The dlllist plugin relies on walking the InLoadOrderModuleList to get the module's information:
The problem with getting the module information from any of these three PEB lists is that they are susceptible to DKOM attacks. All three PEB lists reside in the user space, which means an attacker can load the malicious DLL into the address space of a process and can unlink the malicious DLL from one or all PEB lists to hide from the tools which rely on walking these lists. To overcome this problem, we can use another plugin named ldrmodules.