Tracing allows you to log events while the process is executing. x64dbg supports trace into and trace over conditional tracing options. You can access these options via Trace | Trace into (Ctrl+Alt+F7) and Trace | Trace over (Ctrl+Alt+F8). In trace into, the debugger internally traces the program by setting step into breakpoint, until a condition is satisfied or the maximum number of steps is reached. In trace over, the debugger traces the program by setting step over breakpoint, until the condition is satisfied or the maximum number of steps is reached. The following screenshot shows the Trace into dialog (the same options are provided in the Trace over dialog). To trace the logs, at a minimum, you need to specify the log text and the full path to the log file (via the Log File button) where the trace events will be redirected:
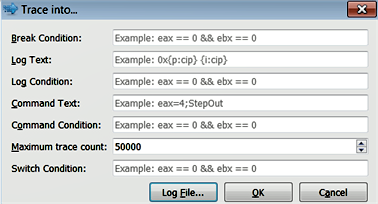
The following includes brief descriptions of some of the fields:
- Breakpoint Condition: You can specify a condition in this field. This field defaults to a value of 0 (false). To specify the condition, you need to specify any valid expression (http://x64dbg.readthedocs.io/en/latest/introduction/Expressions.html) that evaluates to a non zero value (true). Expressions that evaluate to non-zero values are considered true, thereby triggering the breakpoint. The debugger continues tracing by evaluating the provided expression, and stops when the specified condition is satisfied. If the condition is not satisfied, the tracing continues until the maximum trace count is reached.
- Log Text: This field is used to specify the format that will be used to log the trace events in the log file. The valid formats that can be used in this field are mentioned at http://help.x64dbg.com/en/latest/introduction/Formatting.html
- Log Condition: This field defaults to a value of 1. You can optionally provide a log condition that will tell the debugger to log an event only when a specific condition is met. The log condition needs to be a valid expression (http://x64dbg.readthedocs.io/en/latest/introduction/Expressions.html).
- Maximum Trace Count: This fields specifies the maximum step count to trace before the debugger gives up. The default value is set to 50000, and you can increase or decrease this value, as required.
- Log File Button: You can use this button to specify the full path to the log file where the trace logs will be saved.
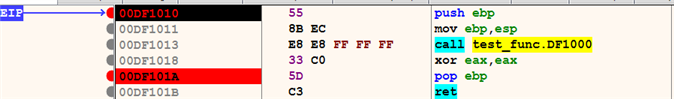
x64dbg does not have specific instruction tracing and function tracing features, but the trace into and trace over options can be used to perform instruction tracing and function tracing. You can control the tracing by adding breakpoints. In the following screenshot, the eip is pointing at the 1st instruction, and a breakpoint is set at the 5th instruction. When the tracing has initiated, the debugger starts tracing from the first instruction, and pauses at the breakpoint. If there is no breakpoint, the tracing continues until the program ends, or until the maximum trace count is reached. You can choose trace into if you want to trace the instructions that are inside the function, or trace over to step over the function and trace the rest of the instructions: