Plotting Tangent Values
When you plot tangent values on the Cartesian plane, you cannot define them at certain points. These points are those that occur as 0 when you plot cosine values. Such values are ![]() , −
, −![]() , −
, −![]() ,
, ![]() . You can see why this occurs if you consider the shapes of the periodic waves that characterize the plotting of the cosine of θ (see Figure 12.17 earlier in this chapter). Whenever the value of the cosine reaches 0, then the value of the tangent is undefined.
. You can see why this occurs if you consider the shapes of the periodic waves that characterize the plotting of the cosine of θ (see Figure 12.17 earlier in this chapter). Whenever the value of the cosine reaches 0, then the value of the tangent is undefined.
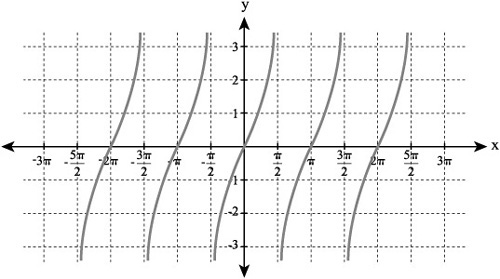
It is undefined because, as you plot tangent values on a Cartesian plane, the resulting curve rises or falls indefinitely as it approaches lines extending vertically from points on the x coordinate at which cos θ is 0. Such a curve occurs when the value of the denominator becomes increasingly smaller. The tangent values in turn become increasingly larger. The values increase indefinitely. This is known as an asymptotic curve.
As Table 12.5 explains, you can formally state that certain values are undefined if you say that tan θ lacks definition at any value of ![]() + kπ. The value of k is any integer. In Figure 12.18, among the values of x defined in this way are
+ kπ. The value of k is any integer. In Figure 12.18, among the values of x defined in this way are ![]() , −
, −![]() ,
, ![]() , and
, and ![]() .
.
Figure 12.18. As you approach values at which the cosine reaches 0, the tangent values become undefined.