
Characterization of the Evolving Grain-Scale Structure in a Sand Deforming under Triaxial Compression
ABSTRACT. This paper is a snapshot of work in progress in which the aim is to analyze possible evolving grain-scale structures associated with localized deformation in a sand specimen undergoing triaxial compression. 3D digital image analysis of in-situ-acquired x-ray tomograms provides a characterization of porosity, contact density and grain coordination number distributions. These characteristics are compared with strain fields derived by 3D-volumetric digital image correlation (DIC), which reveal the development of a localized shear band. Structures conjugate to the main shear band have been observed clearly in incremental DIC-derived shear strain images and also in porosity images. New results on grain contact and grain coordination number distributions suggest that lower values of both exist in the localized strain zone, but bridges of higher coordination-number grains appear to traverse this zone.
KEYWORDS: localization, granular media, in-situ x-ray tomography, digital image analysis, digital image correlation
1. Introduction
To understand the mechanisms of deformation and failure of materials, and in particular strain localization phenomena, requires an entire deformation process to be followed in 3D, at the appropriate scale, while the test specimen deforms under load. This can be achieved using in-situ x-ray tomography (i.e. x-ray scanning at the same time as loading). In recent work (Hall et al., 2010; see also Viggiani et al. “Sand deformation at the grain scale quantified through x-ray imaging”, in this volume) in-situ x-ray micro-tomography with grain-scale resolution of triaxial compression tests on sand has been presented. In this previous work the development of strain localization was studied, based on the tomography images taken at key stages throughout the loading, using two types of 3D-volumetric Digital Image Correlation (DIC). In the first instance “continuum” DIC was used to derive incremental 3D displacement and strain fields for the deforming specimen by essentially ignoring the granular aspect of the specimen and images and treating the medium/image as piece-wise continuous. Despite the neglect of the grains, this analysis provided interesting insight into the development of a localized shear band, with some indications of the grain-scale mechanics.
A second 3D-DIC analysis was carried out that allowed the tracking of the individual displacements and rotations of all the grains in the specimen. This refined grain-scale analysis demonstrated the significant role of grain rotations in the localization process. A key observation from both types of DIC analyses, but perhaps more evident in the continuum results (see later), is the emergence of grain-scale structures (zones of lower or elevated shear strains conjugate to the main band direction) inside the shear band. These structures resemble the “columns” of aligned grains observed in sand by Oda et al. (2004) in post-mortem (i.e. after test) x-ray micro-tomography images and also advocated by Rechenmacher (2006), based on continuum 2D-DIC. Furthermore, Tordesillas and Muthuswamy (2009), amongst others, suggest that the underlying mechanism for shear banding in granular materials is by the buckling of such columns of grains. These aspects need to be further investigated and this work aims to analyze the grain-scale structures that might exist and their evolution by 3D digital image analysis of the x-ray tomograms.
In the following, the experimental data are briefly described before presenting analyses of the structure and structural evolution of the sample based on previous results (porosity analysis and 3D-volumetric DIC) and new analyses to assess the grain and grain-contact organization. This paper represents just a snapshot of work in progress with preliminary results and analyses. For example, only two load steps have currently been analyzed in terms of the grains and grain-contacts – the first, before deviatoric loading, and the seventh, well after the peak in stress.
2. Experimental set-up and material
2.1. Material studied and mechanical response
The experimental results analyzed in this work come from an in-situ triaxial compression test performed on a dry specimen of S28 Hostun sand, under a confining pressure of 100 kPa carried out at the European Synchrotron Radiation Facility (ESRF) in Grenoble on beamline ID15A. The specific loading system used is described in more detail in Hall et al. (2010) (see also Lenoir et al., 2006).
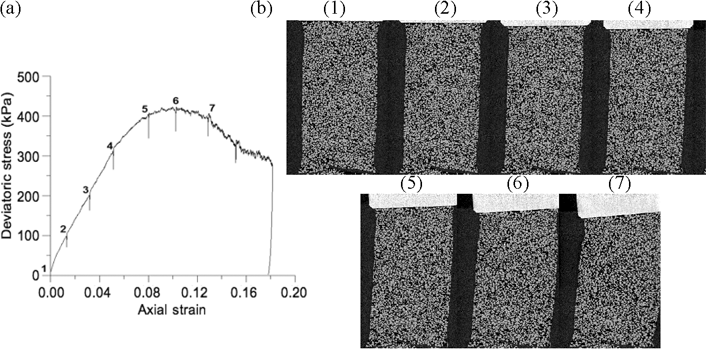
The S28 Hostun sand is a fine-grained, angular siliceous sand with a mean grain size (D50) of about 300 µm. For this test, the sample was 11 mm in diameter and 22 mm high with an initially dense packing (initial void ratio ∼0.6). Figure 1(a) shows the sample stress-strain response, in which a roughly linear initial trend is followed by a curvature to the peak stress at around 11% axial strain. After the peak load, the stress drops and appears to begin to plateau before the sample unloaded. Relaxations can be seen at the moments at which x-ray tomography scans were carried out.
Figure 1. (a) Sample stress-strain response: deviatoric stress (q = the maximum minus the minimum principal stress) versus axial strain. (b) Vertical slices through the x-ray micro-tomography image volumes at the 7 levels of strain indicated in (a). The slices are cut through the middle of the specimen roughly perpendicular to the eventual band of localized strain. For scale: the sample was originally 11 mm diameter and 22 mm high.
2.2. In-situ x-ray micro-tomography
X-ray tomography scans were carried out at key moments throughout the test as indicated in Figure 1(a). Figure 1(b) shows a series of vertical slices through each of these x-ray tomography image volumes. The vertical slices shown are cut through the middle of the volumes roughly perpendicular to the “plane” of localization that developed during the test. The voxel size of these images is 14 × 14 × 14 µm3, which means the individual grains can be clearly identified (the mean grain diameter is around 300 µm or 21 voxels so there are several thousand voxels per grain).
These in-situ images show that in the latter part of the test the sample starts to lean to the right and the upper platen rotates, which is probably the result of a non-perfect sample. From these images, there is no indication of localized deformation is immediately obvious and enhanced analysis is required to visualize and quantify the localization structure as discussed in the following.
3. Data analysis: characterization of structural evolution
3.1. Porosity analysis
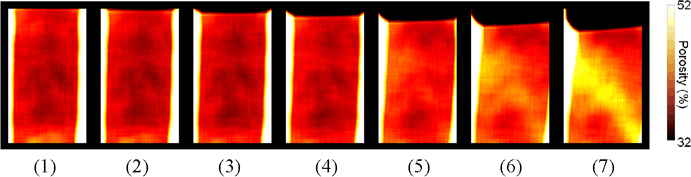
The porosity fields presented in Figure 2 were calculated from the x-ray tomography image volumes described in section 2.2. This calculation was based on a binarization of the images into “grain” and “pore-space” voxels (i.e. a threshold gray-scale value has been defined such that voxels with a gray-scale value above this threshold are considered to be within a grain and those below the threshold, pore space). Porosities are given for overlapping cubic windows of side 141 voxels (1974 µm, about 7 × D50) at every 10th voxel throughout the sample volume. The window size used is a compromise between a good representative elementary volume size and the need for spatial resolution. Note also that the derived values represent the accumulated porosity from the start of the test.
From the porosity fields, an evolving inclined zone of localized porosity increase (dilation) can be seen. Also, there are indications of structure in the band in the form of high and low porosity striping conjugate to the main band orientation.
Figure 2. Vertical slices through the porosity volumes for the 7 load steps indicated in Figure 1(a) for the same positions as in Figure 1(b)
3.2. 3D-volumetric DIC
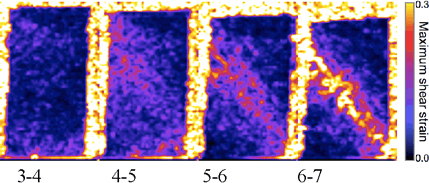
Continuum 3D-volumetric DIC was carried out on consecutive pairs of the 3D x-ray tomography image volumes to provide the 3D displacement and strain fields for each increment. The details of this procedure are presented in Hall et al. (2009) and Hall et al. (2010). Figure 3 shows vertical slices through DIC-derived maximum shear strain volumes; as in the previous images, these vertical slices are cut roughly perpendicular to the “plane” of localization that developed during the test.
The strain images in Figure 3 clearly show the evolution of a localized band that traverses the sample diagonally from top-left to bottom-right. The localization appears to initiate in the increment 4-5, i.e. well before the peak load. Furthermore it can be seen that the band starts as a broad zone and converges towards a narrow band of localization in step 6-7 (the zone is around 5 mm, about 17 D50, at this stage) with a narrower, high strain core. It is also clear that the localized zone is not uniform and shows some structure, including aligned zones of either reduced or elevated strains at angles “conjugate” to the main band direction.
Figure 3. Vertical slices through the incremental maximum-shear-strain volumes for load increments indicated (see Figure 1a); slice positions as previous figures
3.3. Grain contact analysis
The DIC results show that the localized band is not uniform and, while it is well defined (and quite planar), there are aligned zones of reduced and elevated strains at an angle “conjugate” to the main band. The orientations of these zones are similar to those of “columns” of aligned grains identified by Oda et al. (2004) in a shear band in sand. Therefore the shear-strain structures might indicate the presence of columnar structures in the grain assemblage. In order to investigate if indeed these structures are related to some grain-scale organization, e.g. columns, and if such structures evolve with loading, in this section procedures for analyzing grain and grain contact distributions are investigated. At present, just the first and last x-ray tomography images have been analyzed. The first step in this analysis is the identification and separation of the individual grains, which is followed by the identification of the contacts between neighboring grains; these steps are described in the first subsection below. Once the images have been segmented and the contacts identified, it is then possible to characterize the distribution of the contacts, which is discussed in the subsequent section.
3.3.1. Image segmentation and contact recognition
The x-ray tomography volume images of the specimen are segmented in order to identify and label individual grains. This is performed using an image binarization followed by the application of a watershed algorithm using the image-processing package VISILOG (©Noesis, http://www.noesisvision.com/). This yields an image volume in which each grain is assigned a unique label (number) such that they can subsequently be identified and distinguished.
Once the grains are separated and labeled, contacts between grains might be identified. Here, this is achieved by defining a contact by black voxels (i.e. those that are not within a grain) that have direct-neighbor voxels (i.e. those in the surrounding 26 voxels) that belong to two different grains, identified by their unique labels. Applying this approach over the whole volume thus provides a binary or labeled volume of contacts. In fact these are the potential contacts and likely an over-estimate of the number of contacts for two reasons. First, contacts can only be resolved within the resolution of the images (sub-voxel size grain separations will appear as contacts). Second, segmented images are used, in which contacts have been cut to separate the grains, so differentiating cut contacts from grains originally separated by a single voxel is not possible. An alternative approach is to subtract the segmented image from the unsegmented one - the non-zero voxels that remain will be contact voxels, but currently the segmented images are being used.
3.3.2. Contact distribution – contact density and grain coordination number
Given the volumes of contacts it is now possible to quantify their distribution. Currently this has been carried out in terms of the contact density distribution (number of contact pixels per unit volume, a “continuum” field measure like porosity) and the grain coordination number (number of contacts per grain, a “discrete” grain-based measure).
In a similar way to the porosity fields, the calculation of contact density is based on the ratio of black and white voxels (in a binary volume where contacts are the white voxels) in overlapping cubic windows of side 61 voxels (854 µm or about 3 × D50) throughout the sample volume. This procedure yields a 3D map of contact densities throughout the sample in terms of the number of voxels in contacts (i.e. the contact area) per unit volume; an alternative measure would be simply the number of contacts. Figures 4 and 5 show results of the contact density distribution and coordination number calculations for tomography images 1 and 7, respectively.
Figure 4. Slices through the (a) contact density and (b) coordination number volumes at step 1. The three slices in each case are cut through the middle of the volume along the three image axes – the middle slice is the same slice position as in previous figures
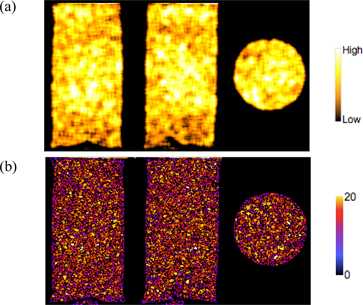
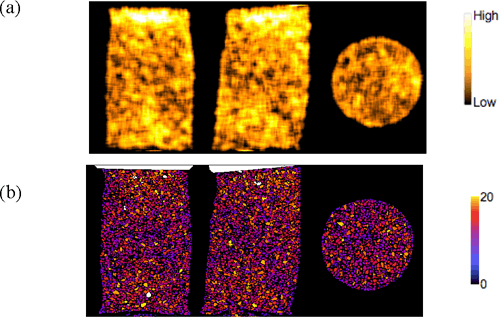
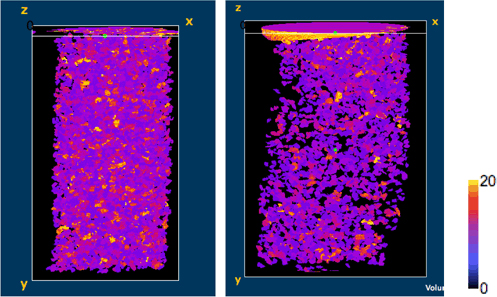
From the images in Figures 4-6 it can be seen that the zone of localized shear strain (see Figure 3) is associated with a lower density of contacts and is populated with lower coordination number grains, which are both consistent with the observed increase in porosity in this zone. It can also be seen that, in general, the coordination numbers were higher and more homogenously distributed at the start of the test, although the contact density maps do indicate some degree of heterogeneity in the contact distribution even before the deviatoric loading. Thus is appears that the localization is associated with a loss of contacts, but so far no clear structures are observed, although, from Figure 6, it can be seen that the zone of generally lower contacts in the localized strain band is traversed by higher coordination number grains. Further quantitative analysis is needed to assess the possible structures in these images.
4. Conclusions
This paper has given a snapshot of work in progress in which the aim is to analyze possible evolving grain-scale structures associated with localized deformation using 3D digital image analysis of in-situ-acquired x-ray tomograms. So far structures conjugate to the main shear band have been observed clearly in incremental DIC-derived shear strain images and also in porosity images. New results on grain contact and grain coordination number distributions have been presented and initial analyses suggest that lower contact densities and lower coordination-number grains characterize the localized strain zone. Additionally, bridges of higher coordination number grains appear to traverse this zone. So far, only two load steps have been analyzed, one before deviatoric loading and the other after the shear band is well developed (and so potentially after structures have been broken). Analysis of the other load steps and of other structural features will yield more insight. It should be noted that much of what is being looked for is related to force chains, which cannot be seen in tomography images. However, for a force chain to exist requires contacts (although the presence of a contact does not indicate force communication nor does the size of contact indicate its importance in terms of force transfer). Therefore, the identification of lines of contacts and changes in contacts with time might indicate some details of the underlying force communication evolution; the continuation of this work should shed new light on such aspects.
Figure 6. 3D rendered view (image J) through the coordination number volumes (left – step 1, right – step7) with thresholding to remove grains with low coordination numbers
5. References
Hall S.A., Lenoir N., Viggiani, G., Desrues J., Bésuelle, P., “Strain localisation in sand under triaxial loading: characterisation by x-ray micro tomography and 3D digital image correlation”, Proceedings of COMGeo09, IC2E, 2009, p 239-247.
Hall S.A., Bornert M., Desrues J., Pannier Y., Lenoir N., Viggiani, G., Bésuelle, P., “Discrete and Continuum analysis of localised deformation in sand using X-ray micro CT and Volumetric Digital Image Correlation”, Géotechnique, in print, 2010.
Lenoir N., Bornert M., Desrues J., Bésuelle P., Viggiani G., “Volumetric digital image correlation applied to X-ray micro tomography images from triaxial compression tests on argillaceous rocks”, Strain, vol. 43, 2007, p. 193-205.
Oda M., Takemura T., Takahashi, M., “Microstructure in shear band observed by microfocus X-ray computed tomography”, Géotechnique, vol. 54, 2004, p.539-542.
Rechenmacher A.L. “Grain-scale processes governing shear band initiation and evolution in sands”, J. of the Mech. and Phys. of Solids, vol. 54, 2006, p.22-45.
Tordesillas A., Muthuswamy M., “On the modeling of confined buckling of force chains”, J. of the Mech. and Phys. of Solids, vol. 57, 2009, p. 706-727.