
Characterization of Porous Media in Agent Transport Simulation
Examining building materials using x-ray computed tomograhy
ABSTRACT. Microscopic geomorphic structure is critical to the process of transport in porous building materials. X-ray scans were obtained on a variety of building materials to both qualitatively and quantitatively evaluate their pore structures. Scanned images were subsequently processed using a random walk analysis to estimate the macroscopic transport properties that are useful for numerical simulation of transport phenomena. 3D image reconstruction was also performed to provide better visualization of the pore structures and a basis for 3D simulation.
KEYWORDS: porous media, characterization, x-ray CT, transport, random walk
1. Introduction
An understanding of geomorphic pore structure of building materials (natural and man-made) in terms of pore size, shape and connectivity is important in contaminant transport studies involving porous building materials. Examples include the transport, fate and remediation of chemical and biological contaminating agents and contamination from fires and acid rain in porous building materials. It is also important to understand the relationship between the geomorphic structure of porous building materials and the properties governing fluid transport within them. Transport in porous media has been investigated theoretically in the context of multiphase flow theory, and is commonly modeled using extended Darcy’s law, or alternatively, modeled directly as a diffusion process. An extensive discussion of the significance of these approaches is beyond the scope of this paper. However, it is evident that pore structures, often characterized quantitatively, are critical for understanding and modeling the transport process in the porous media. Although traditional macroscopic experiments provide an averaged estimate for properties such as porosity, many details of the pore structures cannot be obtained easily with these methods, and consequently, are often neglected or assumed for consideration in numerical simulation. Microfocus x-ray computed tomography allows exploration of building materials and quantification of their geomorphic properties (e.g. Cnudde and Jacobs, 2004; Roels and Carmeliet, 2006).
This paper presents a study on quantifying geomorphic pore structures of various building materials using x-ray tomography. A random walk-based analysis to quantitatively evaluate the transport properties of these materials using their x-ray images is also presented. In addition, 3D image reconstruction of the x-ray images is briefly discussed.
2. X-ray CT scan of porous building materials
2.1. Materials and experimental set-up
A variety of natural and man-made building materials were investigated, including four different types of concrete, three types of sandstone, a limestone, and two types of brick. All x-ray scanning was performed with a micro-focus x-ray CT scanner (Skyscan) at the Geology Department, Amherst College, MA. Specimens of different sizes, ranging from 4 mm to 25 mm in diameter, were scanned at 74 keV (133 µA), with 540 equally spaced images collected across 180°. Three frames were averaged for each image to improve the signal-to-noise ratio, ring artifacts were corrected using a random movement algorithm, and x-ray attenuation slices were generated using a modified filtered backprojection of shadow images. Resulting stacks of cross-sectional images had voxel sizes ranging from 1.5 to 7 µm.
2.2. Scanned images of specimens and image processing
A typical cross-sectional image of a concrete specimen is shown in figure 1a. The grayscale values vary from white to dark gray and the pixel values range from 0 (black) to 255 (white). These colors represent the range of x-ray attenuation through the sample, with black pixels representing the pore space (air) and the white or gray pixels representing the solid space.
To assist in better distinguishing (visually) pore spaces from solid spaces, some image processing measures were employed to convert the original grayscale image to black and white (B/W). We first plotted the pixel distribution (histogram), and then identified the histogram peaks to establish a threshold value that separated the voids from the solids in the original grayscale image. Finally, all the pixels with values less than the threshold were changed to “0” (black); and the pixels with values above the threshold are converted to “1” (white), resulting in a B/W image with pores represented by black and solids represented by white. Lastly, we switched these colors to better match the conventional visualization of x-ray images, using black for solids and white for pores.
This procedure was summarized in Nakashima and Watanabe [2002] and applied to CT scans of an assembly of beads, where clear distinction between beads and pores is readily visible prior to any processing. However, for scanned images of building materials, it is not as easy to distinguish the histogram peak values representing the solids and pores, because it is not an assembled porous system of beads in which the two peaks are well separated.
The pore structure of concrete is a good example of this phenomenon. An area of interest is cropped from the original image (red square of the CT image in Figure 1a). Before the image processing procedure described above is applied, an alternative way to tentatively explore the geomorphic structure is to produce a grayscale picture where the contrast of the image is enhanced, while the histogram of the output image is preserved. Such a picture is shown in Figure 1b, which clearly reveals the coarse aggregates (the lightest gray part) and some small pores (the darkest part) between these aggregates. Most of the space between the coarse aggregates could be finer sand- to clay-size aggregates or cement.
Figure 1c is the histogram of the cropped area of the original cross-sectional x-ray image of 5,000 psi concrete (Figure 1a) where most of the pixels are values less than 100. A closer look at the histogram distribution reveals there are two peaks. The first peak, pixel value 0, represents the pores. The second peak is around the value of 30, which has the largest population, about 1.1×10⁵. Consequently, the midpoint, 15 is chosen as the threshold for separating the solid and pore spaces. The resulting BW picture is presented as Figure 1d after the black and white pixels have been switched. Clearly the pore space represented by white is rather small and primarily reflects the large pores captured by the grayscale image (Figure 1b).
Figure 1. (a) The raw x-ray cross-sectional image of 5,000 psi concrete. (b) A grayscale image for the cropped area of x-ray image in (a). The contrast is enhanced with the original histogram maintained. (c) The histogram of the cropped area (red in (a)). (d) The final BW image of processed x-ray image with a threshold value of 15. (e) The final BW image of processed x-ray image of 5,000 psi concrete with a threshold value of 20. (f) The final BW image of processed x-ray image of 5,000 psi concrete with a threshold value of 25.
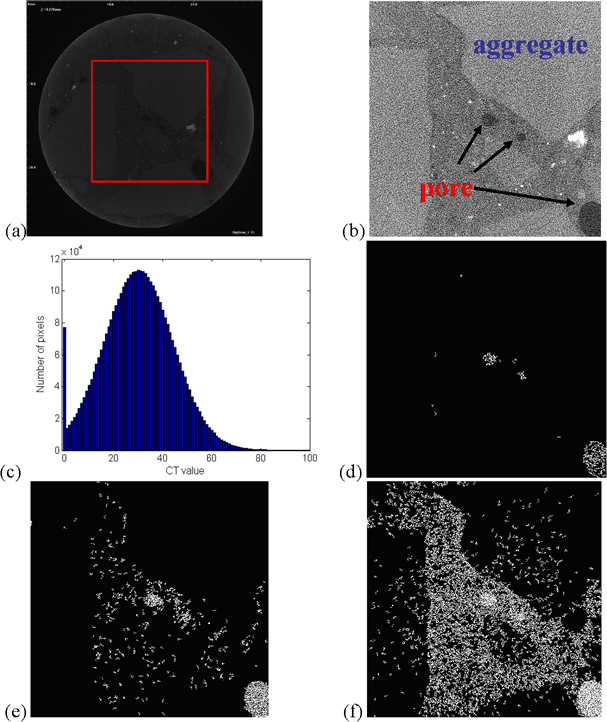
Clearly the amount of pores, in the final B/W picture, depends on the selection of the pixel threshold value. As a result, the threshold value dictates how much of the space between aggregates gets classified as solid or pore space. Figure 1e and 1f are obtained with two different threshold values, 20 and 25, respectively. In comparison with Figure 1d (threshold value of 15), the pores are more abundant when a greater threshold value is used. The boundary of the large coarse aggregates is also evident. In Figure 1f, more of pixels between the coarse aggregates are classified as pores as opposed to fine aggregates or cements in Figure 1d.
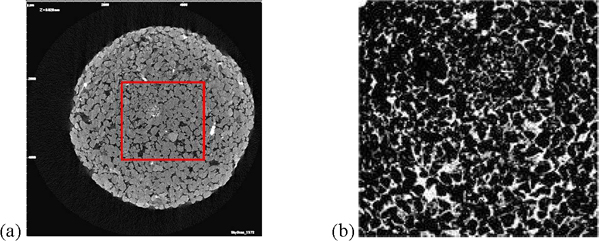
The image is controlled by the physical nature of the porous material, although the processing procedure, quality and limitations of experimental device and set-up are all potentially significant. See, for example, the Ohio sandstone sample shown in Figure 2a. The final cropped BW image is presented in Figure 2b. The boundaries of sandstone grains are evidently distinguishable from the pores.
One approach is to measure the porosity and adjust the contrast threshold until the porosity (estimated using the image alone) reasonably matches the measured porosity. In this study, pixel histograms were generated; however, the threshold was selected also by considering the measured porosity.
Figure 2. (a) A sample x-ray image of Ohio Sandstone, cropped area is outlined by the red square (contrast enhanced). (b) The final B/W image of Ohio sandstone after the completion of the imaging processing
3. 3D image reconstruction
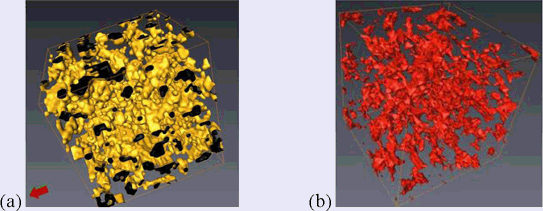
The stacks of cross-sectional x-ray attenuation images were volume rendered in order to reconstruct and analyze the 3D geometry of the pore structures of scanned specimens. This was done using Avizo™ 6.0 software, which converts post-processed cross-sectional image data into 3D volumes or meshes. Through automatic or interactive image slices alignment, registration and segmentation capabilities, Avizo can reconstruct and visualize the 3D volume or the 3D surface of the specified material. Some reconstructed 3D images are presented (Figure 3) and provide good visual evidence of the pore structures in terms of the size, amount and connectivity.
Figure 3. (a) A 3D reconstructed image of the pore structures of a portion of an Ohio sandstone specimen, 0.3 mm × 0.3 mm × 0.3mm. (b) A 3D reconstructed image of the pore structures of a portion of a 5,000 psi concrete specimen, 0.3 mm × 0.3 mm × 0.3mm. The solid colors indicate pores.
4. Quantitative estimate of material properties based on x-ray scans
The simplest property obtained from the CT scan images is the porosity. This may be calculated by counting the number of 1’s (white pixels) in the matrix representing the BW 2D image. The methods for estimating other transport properties such as permeability and tortuosity are more complicated but nevertheless well documented (e.g. Coker et al. 1996, Maier et al. 1998). Here, the random walk algorithm discussed by Nakashima and Watanabe [2002] was adopted to estimate these properties and compare them with macroscopic laboratory test results. The specimens used for CT scans were cored out of the larger specimens used for macroscopic testing. Because the properties of the outer surfaces of concrete and brick used in building materials differ substantially from the properties of their interiors, we sampled the same exterior surfaces for both CT-scan core samples and for macroscopic testing samples.
The relationship of random walk simulation to the Wiener process, a similar process to Brownian motion as the physical phenomenon of a minute particle diffusing in a fluid, has been established in probability and statistics theory (e.g. Fuller, 1968). A detailed discussion of its application can be found in Nakashima and Watanabe (2002). For simplicity, the presented results are also based on the 2D images rather than the 3D reconstructed images since the theoretical background of the random walk algorithms is independent of the image dimensions. However, a 2D analysis would include even those pores that are not connected, whereas the physical measurement would indicate effective porosity (of connected pores).
In the B/W image of the CT scan (e.g. Figure 2b), a walker is initially randomly placed in a pore (white) pixel. It then migrates randomly on discrete pixels with the progress of the dimensionless integer time τ. Usually a large number of these walkers must be simulated and the average of the square distances of all these random walkers are computed as mean-square displacement 〈r(τ)2〉, as a function of τ. If this random walk is completely unrestricted, i.e. in a perfectly full pore space without any solid particles present, 〈r(τ)2〉 is proportional to τ (solid line in Figure 4b), and the proportionality constant will reflect the diffusion coefficient of the walker in the free space without solids (water diffusivity in bulk water).
Figure 4. (a) A 2D random walk trajectory in an image of Ohio sandstone; (b) mean-square displacement of random walk in (a)
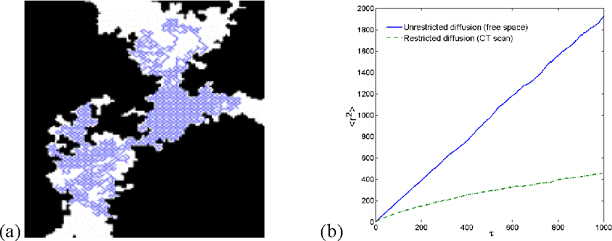
However, because real porous media contain solids (black pixels in Figure 4a), 〈r(τ)2〉 is reduced (solids act as obstacles and whenever a walker encounters a black pixel, it will stay at that same place at that moment). The change in the function of 〈r(τ)2〉 provides a measure for the diffusivity in the real porous materials, and thus, tortuosity may be obtained by comparing the gradient to that of a free random walk 〈r(τ)2〉free. The random walk path must be limited within the pore space, and consequently the gradient of the restricted diffusion is substantially smaller in Figure 4b.
Table 1. Estimate of transport properties (values in brackets are physical measurements)
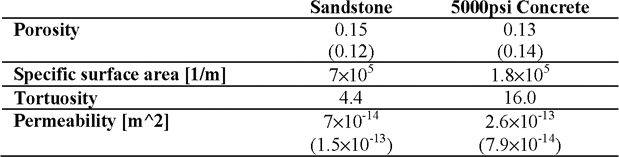
Subsequently, specific surface area and permeability may also be estimated based on the Kozeny-Carman equation. Two sample results are summarized in Table 1. The numbers in brackets are properties measured in the laboratory. The image-based estimates are close to the measured values, and may be considered a success at this stage of the work, although simulations based on 3D images may be more appropriate for our comparison.
5. Conclusions
A number of common building materials were subjected to x-ray CT scanning and used for subsequent 2D and 3D image analyses. 2D image analysis had varied success. For concretes tested in this work, the sensitivity of the final output to the specific processing technique was quite high. Overall the quality of scanned images and the subsequent imaging processing is sufficient for 3D image reconstruction, which provides a satisfying 3D visualization of the pore structures.
Estimates of relevant transport properties are successful to some degree. These values were further used for numerical simulations that are beyond the scope of this paper. Current and future work on CT scans of samples with permeating fluids is expected to reveal more details of fluid wicking process inside the porous building materials.
6. Acknowledgements
This work is supported by Defense Threat Reduction Agency (#HDTRA1-08-C-0021).
7. References
Cnudde, V., Jacobs, P. J. S., “Monitoring of weathering and conservation of building materials through non-destructive X-ray computed microtomography”, Environmental Geology, Vol. 46, 2004, p. 477–85.
Coker, D. A., Torquato, S., Dunsmuir, J. H., “Morphology and physical properties of Fontainebleau sandstone via a tomographic analysis”, Journal of Geophysics Research, Vol. 101, No. 17, 1996, p. 497–506.
Feller, W., An Introduction to Probability Theory and its Applications, Vol. 1. New York, John Wiley & Sons, 1968.
Maier, R. S., Kroll, D. M., Kutsovsky, Y. E., Davis, H. T., Bernard, R. S., “Simulation of flow through bead packs using the lattice Boltzmann method”, Physics of Fluids, Vol. 10, 1998, p. 60–74.
Nakashima, Y., Watanabe, Y., “Estimate of transport properties of porous media by microfocus X-ray computed tomography and random walk simulation”, Water Resources Research, Vol. 38, No. 12, 2002, p. 1272, doi:10.1029/2001WR000937.
Roels, S., Carmeliet, J., “Analysis of moisture flow in porous materials using microfocus X-ray radiography”, International Journal of Heat and Mass transfer, Vol. 49, 2006, 4762-4772.