
Residual CO2 Saturation Distributions in Rock Samples Measured by X-ray CT
ABSTRACT. Understanding multiphase flow and trapping mechanisms in porous rocks at the laboratory-scale is required to design carbon dioxide (CO2) geological sequestration at the field-scale. Coreflood laboratory experiments on sandstones and carbonate rocks using supercritical CO2 and brine were conducted with in-situ saturation monitoring by X-ray Computed Tomography (CT). The residual CO2 saturation obtained by capillary trapping is evaluated experimentally. Supercritical CO2 is injected into a brine saturated core followed by injection of CO2-saturated brine. This prevents the dissolution of carbon dioxide into the brine and the amount of CO2 residual trapping in the rock can be measured. The experimental results show the trapped CO2 saturation ranging from 0.2 to 0.4 for the rocks with permeability ranging from 6 to 220 md. The proposed method with in-situ saturation monitoring reveals piston-like displacement inside homogeneous sandstone, while heterogeneous flow behaviour is observed on a carbonate rock. The relationship between porosity distribution and residual CO2 saturation on the carbonate rock is inferred. Injected CO2 flows through more porous regions but is preferentially trapped in lower porosity zones. In-situ saturation monitoring, therefore, is the key to understand fluid movement and trapping in the rock samples. This work can then be applied to CO2 storage in saline aquifers, where the CO2 may be rapidly and securely trapped as a residual phase.
KEYWORDS: geological sequestration, coreflood, CO2 injection, residual trapping, x-ray CT scanner, in-situ saturation monitoring
1. Introduction
Intergovernmental Panel on Climate Change (IPCC) has published a special report on carbon dioxide capture and storage (IPCC, 2005). It refers to CO2 capture and storage (CCS), which is one of the technical options to reduce greenhouse gas emissions to the atmosphere. CO2 geological sequestration is considered to be a long-term storage option for the gas, and the petroleum industry, which has CO2 Enhanced Oil Recovery (EOR) experiences, can contribute to the advancement of this technology. In geological structures, four trapping mechanisms are present: (1) structural and stratigraphic trapping: the buoyant CO2 remains as a mobile fluid but is stored under impermeable cap rocks; (2) residual phase trapping: disconnection of the CO2 phase into an immobile fraction; (3) solubility trapping: dissolution of the CO2 into the brine, possibly enhanced by gravitational instabilities due to the larger density of the CO2-saturated brine; and (4) mineral trapping, geochemical binding to the rock due to mineral precipitation. In this paper, residual CO2 saturation distributions in rocks are evaluated experimentally with application to CO2 injection into saline aquifers. CO2 is the non-wetting phase case, and capillary trapping of the CO2 is an important mechanism to avoid the leakage.
2. Experiments
2.1. Rock samples
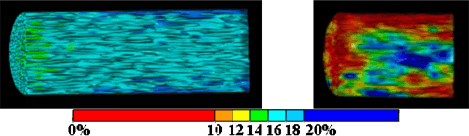
Three sandstones and a carbonate rock shown in Table 1 are prepared as standard plug cores with 38 mm in diameter and between 70 and 140 mm long. Berea sandstone samples with different porosities and permeabilities are firstly compared to identify the effects of porosity and permeability on the saturation. The sandstone samples are composed primarily of quartz but also contain minor amounts of calcite, dolomite, clay minerals and feldspar. In addition, a heterogenous sandstone from Japan and a Middle Eastern carbonate sample are used. The carbonate rock is composed mainly of bioclastic grainstone and packstone with some algal fragments which may form vuggy pore spaces. It exhibits a substantial presence of sub-micron porosity confirmed by the micro-CT image and Mercury Injection Capillary Pressure (MICP) curves (Sok et al., 2007). Prior to the injection, effective porosities of the plug cores are measured with an x-ray CT scanner system (resolution 0.35mm/pixel), which gives the average porosity ranging from 0.14 to 0.27 as shown in Table 1. Typical three-dimensional (3D) porosity distributions are illustrated in Figure 1.
Table 1. Properties of the rock samples under confining conditions
Figure 1. Vertical cuts of 3D porosity distributions of relatively homogenous Berea sandstone 2 (left) and heterogenous Middle Eastern carbonate rock (right), which are imaged by the x-ray CT scanner. Color scale indicates porosity
2.2. Experimental setup/procedure
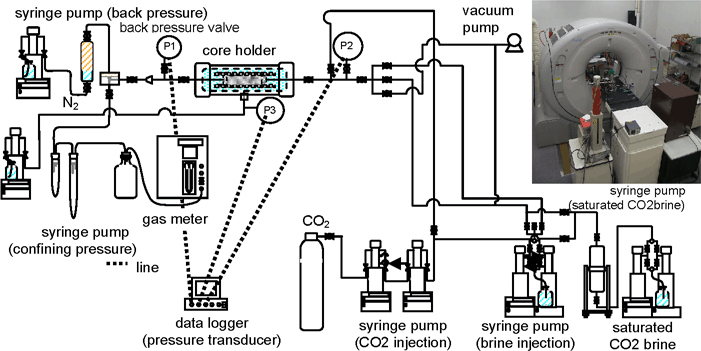
The experimental apparatus with the x-ray CT scanner is shown in Figure 2. The system was previously used for a similar study (RITE, 2007), but it is improved in terms of preparing CO2-saturated brine. Cleaned cores are used as we assume CO2 storage in saline aquifers. The experimental temperature is kept at 40°C and the overburden pressure is 3,000 psig (approximately 20 MPa), excepting the carbonate rock experiment under 2,000 psig (14 MPa). The key steps of the coreflood experiment are summarized below.
1) Prepare injectant (Wet condition supercritical CO2 and CO2 saturated brine).
2) Take a CT image of the plug core under dry conditions.
3) Inject supercritical CO2, and take a CT image under 100% CO2 saturation.
4) Inject brine, and take a CT image under 100% brine saturation to calculate the porosity distribution.
5) Inject CO2 saturated brine, and take a CT image under 100% CO2 saturated brine saturation.
6) Inject brine again to saturate the core.
7) Inject supercritical CO2 at the designed flow rate (capillary number∼10−7) until no more brine is produced and the pressure difference becomes stable (more than 5PV injected). In-situ saturation monitoring is conducted by x-ray CT during the CO2 flooding.
8) Inject CO2 saturated brine at the designed flow rate (capillary number∼10−7) to confirm the CO2 trapping with in-situ saturation monitoring (more than 5PV injected).
Further details of the coreflood procedure with in-situ saturation monitoring by x-ray CT are provided elsewhere (Oshita et al., 2000, Okabe et al., 2006). The accuracy of the CT derived porosity/saturation is dependent on an attenuation contrast of x-ray between fluid phases. In the study, 15wt% NaI is used as a dopant to the brine phase, and the accuracy of the measurements of porosity and saturations is evaluated at ±1 Bulk Volume% and ±2 Pore Volume%, respectively.
Figure 2. X-ray CT coreflood system with developed temperature control units. The rubber heater covers the coreholder, and the line heaters are attached to the fluid injecting lines
3. Results
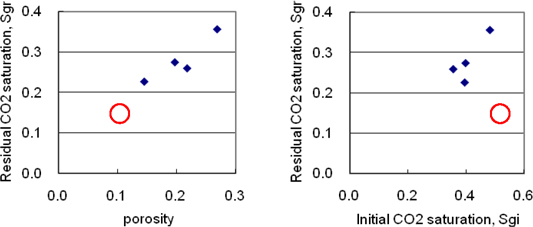
Table 2 summarizes the results of average CO2 saturation measured by x-ray CT after CO2 injection for the initial gas saturation (Sgi) and after post-injection with CO2 saturated brine for the residual gas saturation (Sgr). Figure 3 shows some trends between porosity, Sgi and Sgr although it is difficult to relate porosity and saturations from the figure since a limited number of different rock samples are used so far. The residual CO2 saturations of Berea sandstone are in good agreement of the results of trapped gas saturations estimated from the relationship between pressure and volume under an isothermal expansion (Suekane et al., 2008), which results in the trapped gas saturation in the range from 0.248 to 0.282.
Table 2. Results of CO2 saturations on the samples. Sgi and Sgr are CO2 saturations before and after post-injection with CO2 saturated brine, respectively. Note: more than 5PV CO2 and brine are injected except the Berea 1, which has 2-3PV injection
Figure 3. Experimental results of relationships between porosity, initial CO2 saturation and residual CO2 saturation for the rock samples. Red circle indicates results on a carbonate sample and others are measured on sandstones
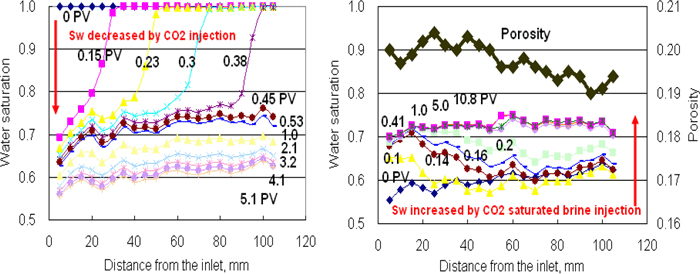
In-situ saturation monitoring can reveal 3D saturation distributions within Berea sandstone sample as shown in Figure 4. The Berea 2 sample has relatively homogeneous porosity distribution as shown in Figure 1 (left). Therefore, homogeneous piston-like displacements are observed both for supercritical CO2 injection (Figure 4 upper) and post-injection with CO2 saturated brine (Figure 4 lower). Figure 5 shows the water saturation profile along the Berea 2 sample. To achieve the designed capillary number (∼ 10−7) for the sample, CO2 injection and post-injection are conducted at the flow rates at 0.93 cc/min and 0.03 cc/min, respectively. In this figure, the fluid front movement is clearly captured. Saturation change becomes small after 0.5 PV CO2 injection, but continues to decrease around 3 PV. While the post-injection with CO2 saturated brine decreases CO2 saturation, but large saturation change cannot be observed after 0.4 PV brine injection. In order to confirm additional saturation change, brine injection is continued to reach 10 PV injection. Since the rock has relatively homogenous porosity profile as shown in Figure 5 right, the saturation distributions before/after the post-injection are also homogenous. The trapped CO2 saturation in the rock is 0.27 on average.
Figure 4. X-ray CT derived water saturation distributions during CO2 injection (upper) and post-injection with CO2 saturated brine (lower) on the Berea 2. Homogenous piston-like displacements are observed for the relatively homogenous sandstone. After 5PV injection of CO2 at the upper right, injectant is switched from CO2 to brine and 0.14PV brine injection is firstly shown at the lower left.
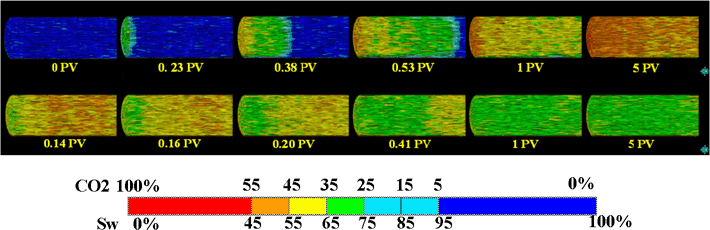
Figure 5. X-ray CT derived water saturation profiles during CO2 injection (left) and post-injection with CO2 saturated brine (right) on the relatively homogenous Berea 2 sample
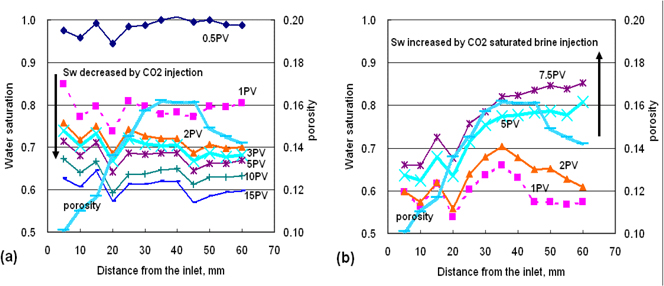
To compare with homogenous rock samples, a carbonate core plug is used and it shows strong heterogeneity in terms of the porosity and the saturation profiles illustrated in Figure 6 (Okabe and Tsuchiya, 2008). X-ray CT shows CO2 flow through more porous areas, which is similar to the water injection to the mixed-wet carbonate rock. The average water saturation is decreased to 0.6 although the flow rate is increased to 4.5 cc/min at 10PV in order to see the additional saturation change due to the rate effect. The water saturation cannot be restored to the initial condition even after 7.5PV post-injection with CO2 saturated brine, and the heterogeneous saturation profile is observed in Figure 6(b). The residual CO2 saturation profile correlates the porosity profile as shown in Figure 6(b). The trapped CO2 saturation in the carbonate rock is 0.23 on average.
Figure 6. X-ray CT derived water saturation profiles during the CO2 injection (a) and post-injection with CO2 saturated brine (b) on the carbonate rock
4. Conclusions
Residual CO2 saturation by capillary trapping is evaluated experimentally. Supercritical CO2 is injected into the brine saturated core followed by the postinjection with CO2 saturated brine. This prevents the dissolution of carbon dioxide into the brine to correctly measure the amount of CO2 residual trapping. The experimental results show the trapped CO2 saturation ranging from 0.2 to 0.4 for the rocks with the permeability range from 6 to 220 md. In-situ saturation monitoring reveals piston-like displacement inside homogeneous sandstone, while heterogeneous flow behavior is observed on a carbonate rock. A relationship between porosity distribution and residual CO2 saturation on the carbonate rock is inferred. Injected CO2 flows through more porous regions, while it is trapped in lower porosity zones. Further studies are required to relate the petrophysical properties of rocks and the residual saturation.
5. Acknowledgements
We would like to acknowledge JOGMEC for granting permission to publish this paper and our colleagues in EOR Research Division for their advices. Special thanks go to Isao Iwasaki and Yasuyuki Akita for their experimental supports and Shigeru Kato for his dedicated visualization works.
6. References
IPCC. Special Report on Carbon Dioxide Capture and Storage, Cambridge University Press, Cambridge, UK. 2005.
Okabe, H. and Tsuchiya, Y. “Experimental investigation of residual CO2 saturation distribution in carbonate rock”, International Symposium of the Society of Core Analysts, SCA2008-54. Abu Dhabi, UAE. 29 October - 2 November, 2008.
Okabe, H., Tsuchiya, Y., Oseto, K. and Okatsu, K. “Development of X-ray CT coreflood system for high temperature condition”, Advances in X-Ray Tomography for Geomaterials, ISTE Ltd., 309-314. 2006.
Oshita, T., Okabe, H. and Namba, T. “Early water breakthrough - X-ray CT visualizes how it happens in oil-wet cores”, SPE Asia Pacific Conference on Integrated Modelling for Asset Management, SPE 59426. Yokohama, Japan. 25-26 April, 2000.
RITE. Report on research and development of carbon dioxide geological storage technologies, Fiscal Year 2006 Report of Research Institute of Innovative Technology for the Earth (RITE), http://www.rite.or.jp/ (in Japanese). 461-509. 2007.
Sok, R. M., Arns, C. H., Knackstedt, M. A., Senden, T. J., Sheppard, A. P., Averdunk, H., Pinczewski, W. V. and Okabe, H. “Estimation of Petrophysical Parameters from 3D images of Carbonate Core”, SPWLA Middle East Regional Symposium. Abu Dhabi, UAE. April 15-19, 2007.
Suekane, T., Nobuso, T., Hirai, S. and Kiyota, M. “Geological storage of carbon dioxide by residual gas and solubility trapping”, International Journal of Greenhouse Gas Control, 2, 1, 58-64. 2008.