
Image-Based Pore-Scale Modeling Using the Finite Element Method
ABSTRACT. Image-based pore-scale modeling is a powerful computational tool for investigating transport in porous geologic materials. Network modeling has been the main tool for pore-scale modeling in the past, with the lattice-Boltzmann method becoming prevalent more recently. The finite element method offers significant advantages because of its ability to operate in multiscale and multiphysics frameworks. We perform image-based modeling of single phase flow in a Berea sandstone to begin understanding issues associated with domain size and mesh refinement. Results suggest a characteristic scale for permeability of approximately 1 mm for the Berea sample. Mesh coarsening is shown to affect both porosity and permeability. However, the flow patterns remain qualitatively consistent (with the same pores taking the dominant flow) between the meshes.
KEYWORDS: finite element, Berea, permeability, image-based, meshing, refinement
1. Introduction
Modeling of porous geologic materials such as reservoir rocks, marine sands, soils, etc. can be performed at two scales: the pore scale or the continuum scale. Pore scale models distinguish the void and solid phases and represent a more fundamental approach to modeling transport in porous media. Alternatively, continuum-scale models treat the porous material as a continuum phase and employ spatially averaged parameters such as porosity and permeability to describe transport processes. This approach is necessary in many applications because of lengths scales and other issues of practicality. However, pore-scale modeling is essential for understanding fundamental behavior and a number of techniques show promise as predictive tools that might replace certain time-consuming laboratory tests.
Computed tomography (CT) techniques have promoted significant advances in the area of pore-scale modeling because microCT and nanoCT techniques allow for non-destructive, quantitative imaging of the interior of porous rocks, soils, and sands. The use of digital images for computational modeling helps ensure that the pore morphology (e.g. pore size distributions, pore-scale heterogeneity, and spatial correlations) found in real materials are captured by the models.
In this paper, we discuss image-based modeling techniques that operate on data obtained from x-ray microtomography. Most image-based modeling techniques consist of three main steps:
2. Pore-scale modeling techniques
During the past 60 years, network modeling has been the main technique for pore-scale modeling. Network modeling was originated by Fatt (1956), and is predicated on discretization of the pore space into pore and pore throats, followed by imposition of mass conservation at each pore. Flow within each pore throat is approximated by a Poiseuille-type relationship, the exact form of which depends on assumptions about the pore geometry. Early modeling employed lattice-based networks, but modern techniques include image-based models that are mapped directly from 3D digital images of porous media (Thompson et al., 2008).
The main advantage of network modeling is its outstanding computational efficiency. However, due to the severe approximations that are employed, it is not as rigorous as methods that approximate the equations of motion directly, which we refer to here as streamline-scale models. This terminology emphasizes their ability to reproduce the vector velocity field within the pore space (and hence fluid streamlines), which contrasts with network models that can be solved for pore-throat flowrates but not sub-pore-scale velocities.
In principle, streamline-scale modeling is simply the application of computational fluid dynamics (CFD) techniques within the void space of porous media. However, this is challenging because of the spatial complexity, heterogeneity, and hierarchy of scales that are present in geologic materials, and the need to incorporate boundary conditions using multiscale and/or multiphysics techniques.
The lattice-Boltzmann method (LBM) has become the method of choice for streamline-scale modeling in the geosciences (Fredrich et al., 2006). Its advantages include the ability to operate directly on the voxel structure obtained from segmented XMCT images (thus eliminating the need for meshing), the easily parallelizable structure of the code, and the relative ease of simulating finite Reynolds number flows.
3. Image-based FEM modeling
Despite the popularity of LBM methods, there are applications for which other CFD techniques will prove advantageous. In this paper, we focus on preliminary results using the finite element method (FEM) for image-based modeling. The main challenge associated with the FEM for this application (and many others) is the issue of meshing. However, if effective image-based mesh generation techniques are available, then the FEM offers significant advantages in modeling hierarchical structures (which require flow to be resolved at multiple scales) and for phenomena that involve solid mechanics.
3.1. Materials
Current simulations were performed using three-dimensional CT images of a Berea Sandstone sample. Data used in the current simulations were obtained at the Center for Advanced Microstructures and Devices (CAMD) at LSU (Baton Rouge, Louisiana, USA). Resolution in this image was 9 microns (on the size of a voxel). The tomography image was segmented using anisotropic diffusion and indicator-kriging thresholding (described in Bhattad et al., “Segmentation of low-contrast three-phase X-Ray Computed Tomography images of porous media”, a separate proceedings paper at GeoX 2010).
Figure 1a shows a subsection of the segmented voxel image, which was the domain size used for the B.120 mesh. The center slice of this domain is shown in Figure 1b. For consistency, this same slice is used to plot flow results and mesh structures below.
Figure 1. Image of CT volume (a) and the slice used for presenting results (b)
3.2. Meshing
Meshing was performed using an in-house mesh generation algorithm that operates directly on the segmented voxel image and offers significant flexibility in the resulting mesh. Parameters that can be used to control the mesh structure include the overall mesh resolution, levels of mesh refinement near solid/void interfaces, and the incorporation of refinement at specific locations of interest. The meshing algorithm is described in detail in a forthcoming paper.
In the current investigation, subregions were extracted from the Berea image and tetrahedral meshes were constructed using these small subsections to study effects of domain size, mesh resolution, mesh refinement, mesh quality and other factors. The work shown here is part of a larger study to understand the impact of mesh structure and mesh coarsening on pore-scale flow simulations. Discussion below is focused on only two of the relevant issues: the impact of the domain thickness in the direction of flow and the impact of mesh refinement at the solid-void interfaces (which can improve how well the mesh conforms to the pore structure).
Table 1. Mesh properties and permeability values for the simulations
Table 1 contains mesh parameters for the set of meshes used in this study. All the meshes were created using the 200×200 voxel cross section shown in Figure 1b (1.8mm×1.8mm). The series-B meshes vary in thickness (30 to 240 voxels, as indicated by the name of each mesh. The series C.R10 through C.R03 has increasing mesh refinement near the solid-void interface. For both the B- and C-series meshes, the interior tetrahedral elements have linear dimension of order 10 voxels (90 micrometers). The B series meshes contain smaller elements near the solid/void surfaces: order 2.5 voxels in linear dimension. The C-series of meshes have the same overall domain size as the B.120 mesh. However, they vary in the level of refinement at the solid/void interfaces, from approximately 5 voxels in linear dimension (C.R10) down to approximately 1.5 voxels in linear dimension (C.R03).
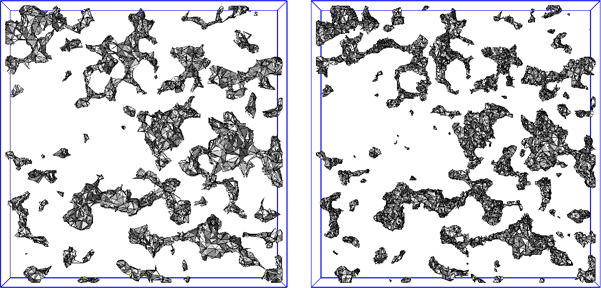
Figure 2 shows a comparison of the C.R10 versus the C.R03 meshes to illustrate the corresponding change in structure. These images represent a thin slice of the 3D mesh in the immediate region of the Figure 1b slice. Note that the improved resolution of the C.R03 mesh requires a more than doubling of the number of elements (see Table 1).
Figure 2. Thin sections of two meshes: C.R10 (left) and C.R03 (right)
3.3. Permeability and porosity values
Because the meshes are created using fairly coarse tetrahedral elements (relative to the voxel resolution), the void space in the segmented image is not captured exactly; this is a necessary consequence of attempting to work at coarser resolutions to improve computational performance. A qualitative assessment of the conformance can be made by comparing Figures 1 and 2. The mesh porosity in Table 1 helps to quantify the effect. The porosity of the voxel image used for the largest mesh (B.240) is 18.94%, and this value varies by approximately 0.7% for different subsections. The porosity of the B-series meshes are approximately 0.9% smaller than the corresponding CT data. The porosity variation for the C-series meshes is more significant due to different levels of mesh refinement near the solid/void interface. There are methods to force the mesh porosity to match the CT data, and these are being examined as part of the larger study.
Permeability values are computed directly from the flow simulations by substituting the applied pressure gradient and the computed bulk flowrate into Darcy’s law. Permeability was not measured on the actual Berea samples that were imaged, so an experimental permeability is not available for comparison. However, the permeability of 1.20×10⁻⁸ cm2 obtained from the largest mesh (B.240) is significantly larger than what is expected for Berea samples (more typically 0.2×10⁻⁸ cm2). The FEM Stokes-flow algorithm used here has been validated using both analytical results in simple geometries and pulse-echo NMR experimental velocities in porous media, so it is not currently clear what is causing this possible discrepancy. The most likely reasons would be one or more of the following: 1. The overall computational domain is not sufficiently large to generate a representative permeability. 2. The image segmentation process created some connectivity that was not present in the real material. 3. Mesh resolution was too coarse, particularly in the tighter constrictions that are most responsible for the resistance to flow. 4. The particular Berea sample that was imaged had a higher-than-expected permeability. These issues will continue to be studied.
3.4. Effect of domain thickness
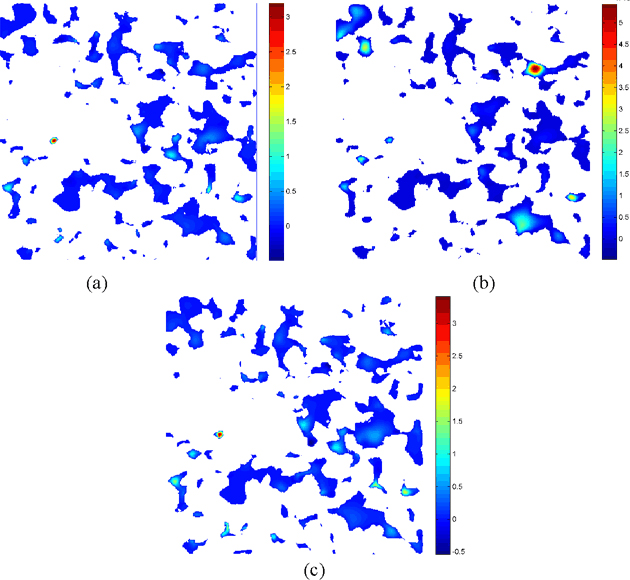
Meshes B.030-B.240 are all centered (with respect to z) around slice 140, thus providing a point of comparison for the different-sized domains. Figure 3 contains a color map of the z component of velocity in this plane obtained using mesh B.240, which we will treat as the most reliable flow field out of the current set. The highest velocity is not in the largest pores on this plane (as it would be in a bundle-of-tubes geometry), but rather in the small circular pore toward the left of the domain. This is typical of flow in a 3D porous material. Specific pathways end up carrying larger fractions of the total flow because of structure at a multiple-pore scale. The highest velocities are found at smaller constrictions along these high-flow paths where the fluid had to accelerate through the constriction.
As the thickness of the mesh is decreased symmetrically around this central slice, the flow distribution will change because the z dimension of the domain becomes too small compared to a characteristic scale for permeability. This causes larger pores that were previously not in high-flow pathways to become more easily connected to the inlet/outlet of the computational domain. The B.120 mesh has essentially the same flow pattern as the larger B.240 mesh. The B.060 mesh begins to exhibit significant differences from the larger domains. Finally, the smallest mesh tested (B.030) exhibits a dramatically different flow pattern on the central slice (Figure 3b), with a few of the larger pores conducting the bulk of the total flow. This behavior is also reflected in the permeability values, which are essentially constant for meshes B.240, B.180, and B.120, but are larger for B.060 and B.030. These results suggest that the Berea sample exhibits a characteristic scale for permeability of approximately 1 mm (in the direction of flow).
Figure 3. Color maps of the z velocity component: (a) mesh B.120; (b) mesh B.030; (c) mesh C.R10. The color bars give velocity in units of 10−4 cm/s
3.5. Effects of mesh coarsening
The C-series meshes were created by coarsening/refining the elements at the void-solid interface (while leaving interior elements the same size). In principle, this procedure should allow one to improve how the mesh conforms to the pore structure while maintaining computational efficiency. The four C-series results show increasing porosity and permeability as the near-surface elements become coarser, which was an unintended consequence of the surface refinement and will be examined further in the future to ensure better control of this parameter.
In moving from the more refined C.R03 mesh to the coarser C.R10 mesh, the permeability increases by a factor of two. However, the reason for the permeability change is different than what was observed for the B-series meshes. When the domain size was decreased, permeability increased because the flow pattern was dramatically altered, with the highest flows occurring in a completely different set of pores. In contrast, the flow patterns remain similar across the C-series meshes in the sense that the same pores carry the larger flow fractions (i.e. the hot-spots in the velocity plots remain at the same locations). The reason for the increase in permeability is that the velocity becomes proportionally larger over most pores, which is attributable to a combination of the higher porosity meshes and/or the coarser meshes (the latter effect limiting the ability to resolve flow in the tighter constrictions, where the bulk of the frictional losses occur).
Figure 4 helps to quantify this effect. It shows non-dimensional z-components of velocity plotted along a horizontal line that passes through the small hot spot in the B.240 mesh. The B.030 velocities along this cut are significantly smaller, despite the fact that the overall flowrate for the B.030 results is 4× higher (for the same pressure gradient), emphasizing the shift in high flows to other pores. The C.R10 velocities remain more or less in proportion compared to the B.240 results, but are larger (and less detailed) in most of the pores, which is attributed to the coarser, higher porosity mesh.
4. Conclusions
The FEM has attributes that will make it a powerful image-based modeling technique. Results shown here emphasize the importance of the mesh generation step: changes in porosity, permeability, and flow patterns accompany strategic coarsening of the mesh. However, mesh coarsening will remain an essential tool for image-based FEM modeling to help optimize computational performance and the ability to perform multiscale modeling. Further research is essential to develop strategies to perform mesh refinement and mesh coarsening without compromising the computational results obtained.
5. Acknowledgements
The authors would like to thank Pradeep Bhattad and Clint Willson for providing the segmented Berea image. We acknowledge Schlumberger Corp. and BP America for supporting this work. N. Lane acknowledges the CFD IGERT at LSU for their support.
6. References
Fatt, I., “The network model of porous media. 1. Capillary pressure characteristics,” Transctions of AIMME, vol. 207, no. 7, 1956, p. 144-159.
Fredrich, J.T., A.A. Digiovanni, and D.R. Noble, “Predicting macroscopic transport properties using microscopic image data,” Journal of Geophysical Research – Solid Earth, vol 111, no. B3, 2006.
Thompson, K.E., C.S. Willson, C.D. White, S.L. Nyman, J.P. Bhattacharya, and A.H. Reed, “Application of a new grain-based reconstruction algorithm to microtomography images for quantitative characterization and flow modeling,” SPE Journal, vol. 13, no. 2, 2008, p. 164-176.