
X-ray CT Imaging of Coal for Geologic Sequestration of Carbon Dioxide
ABSTRACT. Concerns about global warming have motivated research and field projects for geologic sequestration of carbon dioxide by its injection into unmineable coal seams. We report x-ray CT measurements of coal heterogeneities and high-permeability regions in coal, bulk compressibilities and carbon dioxide concentration gradients produced by its diffusion through the coal matrix. Gravimetric measurements performed to examine the accuracy of the CT measurements of carbon dioxide concentrations also are discussed.
KEYWORDS: coal, heterogeneities, compressibilities, carbon dioxide, sorption
1. Introduction
The study of coal by X-ray computerized tomography almost certainly began in 1982 (Maylotte et al., 1982). Since then, about twenty other studies have appeared.
In recent years, X-ray CT studies of coal frequently have been motivated by the potential for sequestration of carbon dioxide to reduce atmospheric concentrations of this greenhouse gas (White et al., 2005). Injection of carbon dioxide into coal seams may also lead to enhanced production of coalbed methane. For sequestration, the two technical parameters of most interest are the sequestration capacity, that is, how much carbon dioxide can be “stored” in a seam of coal, and the injectivity, which is a quantitative measure of how rapidly carbon dioxide can be injected into a seam. In this paper we present and consider X-ray CT imaging data for the heterogeneities, carbon dioxide diffusivities, sorption isotherms, and elastic behavior of coal. These kinds of measurements are of considerable importance for sequestration of carbon dioxide in coal.
2. Experimental
The samples of bituminous coals, methods of sample preparation, sample holders, CT imaging equipment and methods, and equipment and methods for sample compression or introduction of carbon dioxide have all been described elsewhere (Jikch et al., 2009a, 2009b; Smith et al., 2007, 2009).
3. Results
3.1. Coal heterogeneities
Figures 1(a) and (b) illustrate computer tomography images of a Pittsburgh coal core, containing two different amounts of carbon dioxide, measured at atmospheric pressure. These images illustrate the very great heterogeneities exhibited by coal, and the ability of x-ray CT to measure different carbon dioxide concentrations.
3.2. Coal compressibilities
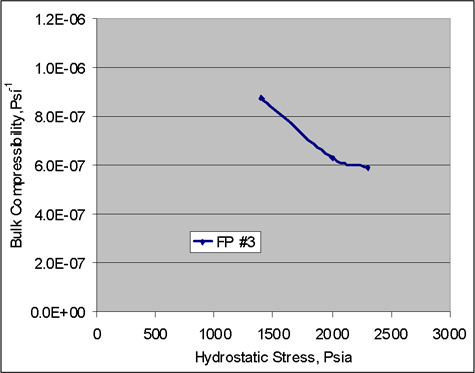
Figure 2 illustrates the compressibilities at different confining pressures as obtained from CT data of Upper Freeport sample #3. The permeability and thus the injectivity depend, in part, on the coal compressibility (McKee et al., 1988).
Figure 1. Computer tomography images of a 2.5 cm diameter coal core, measured at 130 kV and atmospheric pressure: (a) before degassing, “immediately” after depressurization from exposure to CO2 at 1.38 Ma (200psi); (b) after gravimetric degassing for about one hour. Each image represents a trans-axial disc 0.20 mm thick.
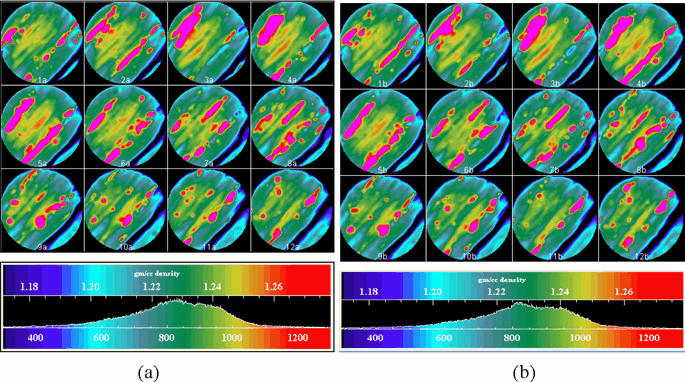
Figure 2. Bulk compressibilities as obtained from CT data at different confining pressures for Upper Freeport sample #3
3.3. Calibration of CT measurements of carbon dioxide content
It is very desirable that the accuracy of carbon dioxide concentrations obtained by CT measurements first be confirmed by comparison with some other measurement technique. For this purpose, the technique of “ambient pressure gravimetry” was developed (Smith et al., 2007). In this technique, carbon dioxide is allowed to escape from a sample previously exposed to CO2 at elevated pressure, and the resultant changes of sample weight and changes of carbon dioxide content as measured by x-ray CT are compared.
Figure 1 illustrates computer tomography images of a Pittsburgh coal core, measured at 130 kV and atmospheric pressure: (a) “immediately” after depressurization to ambient, atmospheric pressure following prolonged exposure to CO2 at 1.38 Ma (200 psia) and (b) after it had (partially) degassed into the atmosphere for about one hour while resting on an automatic analytical balance to record its changes of weight as it lost carbon dioxide. The differences between the images can provide an accurate measurement of the difference in the amounts of carbon dioxide in the sample before and the degassing period.
Figure 3 is a plot vs. the square root of elapsed time of the mass of a coal sample as it degassed previously sorbed carbon dioxide into the atmosphere while sitting on the pan of the recording balance. Also shown on the plot is the mass of the sample as measured by CT measurements made immediately before and after the weighing interval, plotted on the same time scale. (The choice of time1/2 linearizes the gravimetric data, as expected for Fickian diffusion.) For this sample of Pittsburgh coal, the carbon dioxide content measured by x-ray CT was about 6% less than measured by ambient-pressure gravimetry, confirming with reasonable agreement the accuracy of the carbon dioxide content as obtained from the measurements.
3.4. Carbon dioxide sorption and density histograms
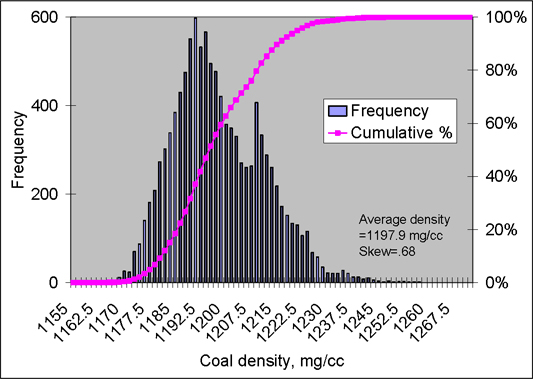
In the measurements of this paper, there were circa 9900 voxels in each slice, each voxel representing a parallelepiped of (measured) dimensions 0.21 mm × 0.21 mm × 2.0 mm. Figure 4 represents the histogram for the circa 9900 voxels density of “slice #1” of the evacuated Pittsburgh coal sample (before gas injection), that is the 2 mm thick disc of coal nearest the eventual carbon dioxide inlet. The average density for the slice is 1197.9 mg/cm3; the skewness factor is 0.68. (For a perfectly symmetrical distribution the skewness factor is 0.) There is a distinct indication of an overlapping, bimodal distribution, with apparent maxima at about 1,193 mg/cm3 and 1209 mg/cm3. Hence, the average skewness factor (measure of the asymmetry) of the total distribution, 0.68, appears to represent the influence more than one, perhaps individually symmetric, distributions.
As part of the attempts to better understand and predict the sorption of carbon dioxide by coal and the effects of sorption on coal properties, an outstanding question is whether and how sorbed carbon dioxide changes the coal structure (Larsen 2004). Figure 5 is a histogram for the voxel densities of Figure 4 after 1065 total hours of exposure to CO2, at a succession of increasing pressures, culminating in sorption at 903 MPa (614 psia), followed by degassing of the sample.
Figure 3. For the sample of Pittsburgh coal, carbon dioxide content measured by CT was about 6% less than measured by ambient-pressure gravimetry
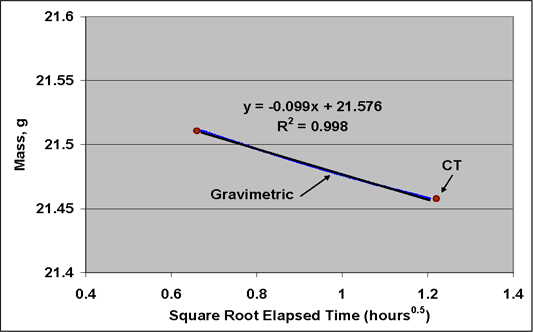
Figure 4. Histogram for the voxel densities of slice #1 of the Pittsburgh coal sample before injection of CO2
The average density in slice #1 was 1198.9 mg/cm3 after degassing, vs. 1197.9 mg/cm3 initially. This very small difference (0.08%) seems to indicate that, at most, a very small amount of CO2 remained in the core; and it could even reflect irreversible mechanical compaction by the confining pressure applied to the sample. However, while the average density of the slice after degasification returned to almost its pre-injection value, the frequency distribution of the voxel densities in the slice did not. The most-frequent density before sorption and after degasification remained virtually the same. However, the calculated average skewness of the distribution was 0.82 after degasification, 0.67 before sorption of CO2. Comparison of Figures 4 and 5 reveals obvious changes in the frequency distribution; in particular, the notable “second peak” at higher densities and bimodal distribution before sorption and compression appears to have disappeared in Figure 5. The latter change suggests a structural re-arrangement in the slice may have occurred due to CO2.
3.5. Carbon dioxide diffusion
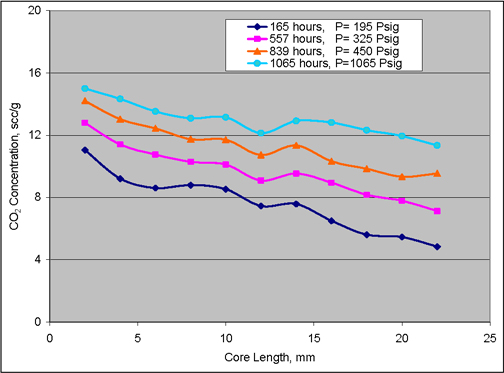
The rate of diffusion of carbon dioxide through the coal matrix is very important, since it may affect the amount of methane produced and carbon dioxide sequestered (Smith et al., 2005). Figure 6 is a plot of slice-average CO2 concentrations vs. nominal diffusion distance for diffusion, at different pressures of carbon dioxide, in a sample of Pittsburgh #8 coal from the Emerald Mine. For each gas pressure, the confinement pressure was 200 psia greater than the gas pressure, so that the effective pressure was nominally constant. Carbon dioxide first diffused for 165 hours at gas pressure 210 psia into the initially gas-free sample; next diffusion occurred at 340 psia for 392 hours (total elapsed time 557 hours) into the non-degassed sample; etc. Hence, only for the data at 210 psia can the convenient boundary condition of zero carbon dioxide concentration at infinity be assumed. Moreover, the local minima and maxima in the data illustrate that the convenient assumption of one-dimensional diffusion into a homogenous solid also would be only an approximation. For example, places where the carbon dioxide concentration increased with increasing distance imply that carbon dioxide diffusion occurred from less-concentrated to more-concentrated regions. While this is thermodynamically possible (since diffusion is driven by the Gibbs free energy, not the concentration), it seems unlikely. The more probable reason is that Figure 6 represents average concentrations for cross-sections orthogonal to the nominal direction of flow. Fits of simple analytical equations to the smoothed data of Figure 6 would give only approximate measures of the effective diffusivity.
Figure 5. Histogram for the voxel densities after the core was degassed
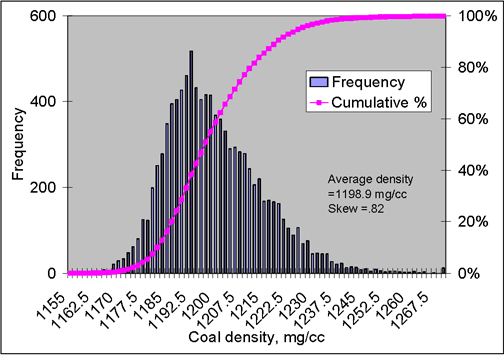
Figure 6. CO2 concentrations vs. diffusion distance in Pittsburgh #8 coal from the Emerald Mine
4. Conclusion
In support of the development of geologic sequestration of carbon dioxide in coal, density heterogeneities of (bituminous) Pittsburgh coal have been measured by x-ray CT imaging. Spatial distributions of carbon dioxide sorbed within the coal also are reported. The effects of sorption followed by desorption on changes of coal density are examined. Measurements that illustrate the slow diffusion of carbon dioxide have been made. To ensure that the measured CO2 concentrations were accurate, concentrations of sorbed carbon dioxide as measured by x-ray CT were compared with concentrations measured by a novel gravimetric technique.
5. References
Jikich, S. S., McLendon, R., Seshadri, K., Irdi, G., Smith, D. H., “Carbon dioxide transport and sorption behavior in confined coal cores for carbon sequestration”, SPE Reservoir Engineering & Evaluation, vol. 12 no.1, p. 124-36, 2009a.
Jikich, S. A., McLendon, T. R., Smith, D. H. “Permeability variations in Upper Freeport coal cores due to changes in effective stress and sorption”, Proc. SPE Annual Technical Conference and Exhibition, New Orleans, LA, 4-7 October, 2009b.
Larsen, J. W., “The effects of dissolved CO2 on coal structure and properties”, International Journal of Coal Geology, vol. 57 no. 1, p. 63-70, 2004.
Maylotte, D. H., Kosky, P. G., Spiro, C. L., Lamby, E. J., Computed tomography of coals, quarterly technical progress report no. 1, August 16, 1982 - November 28, 1983, General Electric Company: Schenectady, New York (1982) 13 pages, DOE/MC/19210-1466, DOE contract number: AC21-82MC19210. [Available through NETL library, Morgantown, WV]
McKee, C. R., Bumb, A. C., Koenig, R. A., “Stress-dependent permeability and porosity of coal and other geologic formations”, SPE 12858, SPE Formation Evaluation, vol. March 1988, p. 81-91.
Smith, D. H., Sams, W. N., Bromhal, G., Jikich, S., Ertekin, T., “Simulating carbon dioxide sequestration/ECBM production in coal seams: effects of permeability anisotropies and diffusion time constant”, Soc. Petrol. Engrs. Reserv. Eng. Eval., vol. 8, p. 153-163, 2005.
Smith, D. H., Jikich, S. A., Seshadri, K., “Carbon dioxide sorption isotherms and matrix transport rates for non-powdered coal”, 2007 Proc. International Coalbed Methane Symposium, Tuscaloosa, AL, 21-25 May 2007.
Smith, D. H., Jikich, S. A., “Permeability, elastic, and carbon dioxide-sorption properties of Upper Freeport cores from a carbon dioxide sequestration/enhanced coalbed methane field project”, Proc. International Coalbed & Shale Gas Symposium, Tuscaloosa, AL, 18-22 May 2009.
White, C.M., Smith, D. H., Jones, K. L., Goodman, A. L., Jikich, S. A., LaCount, R. B., DuBose, S. B., Ozdemir, E., Morsi, B. I., Schroeder, K. T., “Sequestration of carbon dioxide with concomitant enhanced coalbed methane recovery-- A review”, Energy & Fuels, vol. 19, p. 659-724, 2005.