
Characterization of Shear and Compaction Bands in Sandstone Using X-ray Tomography and 3D Digital Image Correlation
ABSTRACT. In this work we employ x-ray tomography, 3D digital image analysis and 3D-volumetric digital image correlation techniques to characterize localized deformation phenomena in sandstone. The specimens considered have been deformed in triaxial compression under a range of confining pressures (20-190MPa). Shear or compaction bands were observed, at low and higher confinement respectively. X-ray tomography images have been acquired before and after loading (unconfined) at different spatial resolutions (30 and 90 µm voxel size). The combination of both x-ray tomography and 3D DIC provides insights into the geometry and mechanisms of the localized features.
KEYWORDS: sandstone, localization, shear bands, compaction bands, x-ray tomography, 3D digital image correlation
1. Introduction
Porous sandstones generally exhibit strain localization when loaded in triaxial compression. The geometry and mechanisms of the localization features depend on the applied confining pressure; in general, shear bands are observed for low to middle confining pressures while compaction bands occur with higher confinements. Studies of such localization phenomena at the laboratory scale can provide useful insight into the mechanisms and internal structure of shear zones, faults and compaction bands at a reservoir scale. This can thus lead to better understanding of fault-leakage or -sealing and flow-barriers due to compaction features, which is of keen interest for hydrocarbon production and subsurface storage of CO2.
In the laboratory, conventional measurements, of forces and displacements made at a specimen boundary, describe only a “global” behavior of the studied specimen. Even when local measurements are made, for example displacement measurements via LVDTs mounted on the surface of the specimen, the evolution and propagation of localized deformation are difficult to characterize. Consequently, the development and application of full field techniques, (e.g. ultrasonic tomography (UT), acoustic emissions (AE), x-ray tomography (x-ray CT) or digital image correlation (DIC)), has become increasingly common (see for example the recent review paper by Viggiani and Hall, 2008). The greatest advantage of these non-conventional laboratory techniques is the measurement of fields of some parameters, i.e. ultrasonic velocity (UT), density (x-ray CT) and displacement/strain field (DIC).
In this paper some results obtained by x-ray tomography and 3D-DIC, using both High Resolution (hereafter HR, ∼30 µm voxel size) and Low Resolution (hereafter LR, ∼90 µm voxel size) x-ray images, are presented. The materials studied are porous sandstones that have been deformed under triaxial compression. The two full field techniques (x-ray CT and 3D-DIC) are first presented followed by a brief description of the experimental program. Subsequently a few selected results are provided for three sandstone specimens that have been deformed at different confining pressures.
2. Full field non-destructive techniques
2.1. X-ray computed tomography
X-ray tomography is a powerful tool to map 3D density variations, and thus 3D structure, in material. This technique has been widely used for the study of geomaterials, including, in a few cases, for the characterization of localized deformation in sandstones (e.g. Louis et al., 2006).
The x-ray tomography images presented in this paper were obtained using the x-ray facility at Laboratoire 3S-R in Grenoble. A number of specimens of Vosges sandstone were scanned (unconfined) before and after triaxial compression tests plus a single specimen of Bentheim sandstone has been scanned after loading. These x-ray scans were either HR (30 × 30 × 30 µm3 voxel size) or LR (90 × 90 × 90 µm3 voxel size).
2.2. Digital Image Correlation
Digital Image Correlation (DIC) is a method that is being used increasingly in experimental mechanics to measure displacement and deformation fields over surfaces (e.g. Pan et al., 2009) or through a volume (e.g. Bay, 2008). DIC is based on the comparison of two digital images of a specimen at different deformation states. First a set of node points is defined in one image, then, for small subsets of this image defined around each node, a search is made for the equivalent image subset in the second image, taking into account the geometrical transformation between the images (this transformation can include displacements, rotations and strain, although in the current case just rigid translation is assumed). This procedure provides a displacement-vector field, which describes the transformation of one image to the other. In this work, we employ a 3D-volumetric DIC code developed at Laboratoire 3S-R (see Hall et al., 2009, for an overview) on HR and LR x-ray images of the each specimen before and after triaxial compression
3. Experimental work: materials studied and experimental program
The principal material in this study is Vosges sandstone. This rock has a pink color, contains 93% quartz, 5% microcline, 1% kaolinite and 1% mica, with a mean grain size of about 300µm (Bésuelle, 2001). The average porosity of the samples studied is 22%. In addition analysis of a specimen of Bentheim sandstone is provided as a comparison; in this case only post-mortem HR x-ray images are presented and no mechanical data are discussed. The Bentheim sandstone is a more homogenous sandstone of yellow color containing 95% quartz, 3% feldspar and 2% kaolinite with a porosity of about 22% and mean grain size of about 300 µm (Stanchits, 2009).
In the larger project of which this work is a part, we study the mechanical behavior of the Vosges sandstone under triaxial compression for a range of confining pressures (20-190 MPa) and implement a series of experimental techniques (UT, AE, x-rays, DIC) to study the deformation mechanisms and structures. This porous sandstone loaded under triaxial compression develops dilating and compacting shear bands for low (10-30 MPa) and medium (40-60 MPa) confining pressures, respectively (Bésuelle, 1999). At higher confinements, roughly horizontal compaction bands are observed. The experimental campaign included 7 tests with loading under low and middle confinements and 6 with loading under higher confinement. Cylindrical specimens (40mm in diameter and 80 mm in height) were cored perpendicular to the bedding. The specimens have two opposite flattened surfaces throughout their height. This particular geometry is necessary for the UT (not presented in this paper). Moreover, notches were machined on the surface of the specimens to encourage the localization to occur between these two flattened faces. Samples deformed at low and middle confinements have two shifted notches (2.5 mm depth and 2 mm wide) on the flattened surfaces while samples deformed at higher confining pressures have a circumferential notch (4mm depth and 0.8 mm wide) in the middle of their height. A teflon O-ring of about 0.7 mm thickness was used to fill the circumferential notch. All specimens were tested dry. Ultrasonic (P-waves) and x-ray measurements were carried out before and after the majority of the experiments. AE were recorded during a few tests.
4. Results and discussion
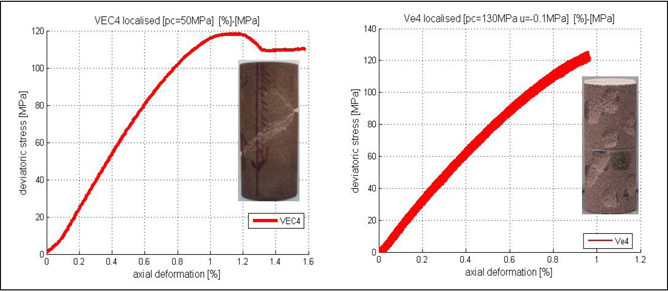
In this paper, x-ray images and DIC of two Vosges specimens are presented. VEC4 was loaded under 50 MPa confinement and Ve4 under 130 MPa. Mechanical data and photographs of both specimens after testing are presented in Figure 1. In test VEC4 the loading was stopped well after the peak stress (∼0.4% after the peak strain) while for Ve4 loading was stopped before a peak in stress was observed. X-ray tomography images of BE6 Bentheim specimen, which was deformed at 185 MPa confinement, are also presented for comparison with Ve4.
Figure 1. Stress-strain curves for the triaxial compression tests and photographs of specimens VEC4 deformed in 3S-R and Ve4 deformed in GFZ (the circular marks on the surface of the latter are the traces of transducers used during AE measurement)
4.1. Characterization of shear band structure in the Vosges sandstone
For VEC4 (Vosges) HR x-ray tomography has been used to visualize the shear band structure in 3D. Figure 2 shows a set of vertical slices through the x-ray tomography volume of the specimen. Three bands of darker colors, which indicate higher density, can be seen; these are interpreted as compacting shear bands. From the images it can be inferred that these bands initiated from both notches and traversed the sample to meet near the middle. Another band can be seen heading upwards from the upper notch at a similar angle to the two main bands, but is not so well developed. The bands are not planar and their structure evolves in 3D. The width of the bands ranges from 270 µm to 750 µm (i.e. about 1-2.5 grain diameters - recall that the mean grain size is 300 µm). It is worth noting that this specimen was loaded until after peak stress, so we expect a wider damaged zone around the central part of the shear band. Near the notches cracks are visible (light color indicates lower density); these have a mean width of approximately 60 µm.
Figure 2. Images from a to ƒ represent sequence of views (x-z plane) through the image (y axis) showing the 3D structure of the shear band in VEC4 Vosges specimen (g)
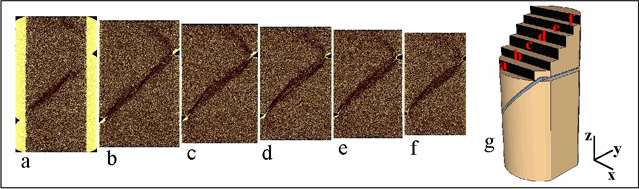
Figure 3. DIC-derived strain maps from the LR x-ray images of VEC4: a) shear strains, b) volumetric strains. These 2D images represent the median values of all the vertical slices (x-z plane) projected along the y-axis
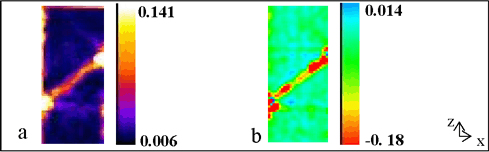
Figure 3 presents the shear and volumetric strains derived from the 3D DIC using LR x-ray images. Shear strain inside the band ranges from 4% to 11%. The shear band is compacting reaching even 18% of volume reduction. Some dilation in the zone just outside the band is also seen. Note that the thickness of the shear band is probably over-estimated in the 3D DIC images as the resolution depends on the image subset, over which the correlation is calculated (in this case 15 voxels, i.e. 1.353 mm3) and the analysis grid spacing (in this case 10 voxels or 0.9 mm).
4.2. Characterization of compaction band structure in the Vosges sandstone
The detection of the localized band in Ve4 Vosges specimen, which was deformed at 130 MPa confining pressure, was quite challenging. AE data recorded during the loading indicate that the band was not fully developed. Moreover, under this level of confinement, the expected localized structures are much narrower. Using only raw x-ray tomography images the compaction band indicated by the AE recording could not be resolved. In previous work (Louis et al., 2006) local statistical measures of the gray-level values such as skewness and standard deviation have been demonstrated to be useful in highlighting the complex geometry of compaction bands. For specimen Ve4, we found that the local standard deviation of the image grayscale allowed the detail of the localized features to be seen (here the calculation was made over a small volume centered on each pixel of 7 voxels3). In this case, the compaction bands appear as zones of decreased standard deviation, which probably indicates a reduction in grain size, due to grain crushing, to below the voxel size and thus a homogenization of the image.
Figure 4. Sequence of slices cut through the volumes of local standard deviation of the HR x-ray tomography images of Ve4 specimen (g). The slices are cut parallel to the specimen axis in the plane perpendicular to the flattened faces that contain the notches: (a) to (f) are progressively deeper into the volume as in Figure 2.
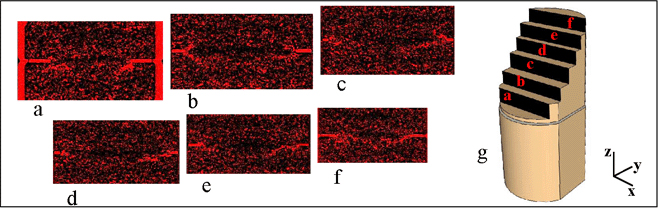
Figure 4 shows the local standard deviation images for the Ve4 specimen and the resolution of the structural complexity of the compaction band. Red depicts the low standard deviation values, while black represents less homogenous regions compared to the compaction band. The band initiates and propagates near the notch, but does not evolve to the central part of the specimen (something already shown in AE of this specimen).
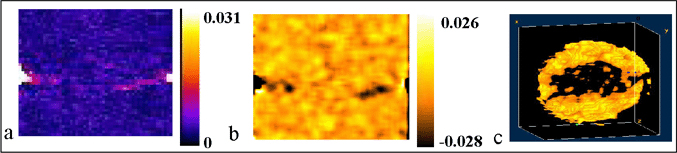
Figure 5 shows vertical slices through the 3D-DIC-derived shear- and volumetric-strain volumes. HR x-ray image volumes were used for the DIC in this case. The shear strain in the band ranges from 0.6% to 1.8% and the volumetric strain reaches 2.7% of the volume reduction. Figure 5c shows a thresholded 3D view of the volumetric strain field highlighting the 3D geometry of the compaction band.
Figure 5. DIC-derived strain maps from the HR x-ray images of Ve4: (a) shear strains, (b) volumetric strains (c) thresholded 3D view of the volumetric strain field
4.3. Visualization of compaction band on Bentheim sandstone
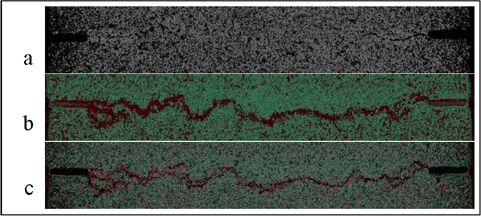
BE6 Bentheim specimen was deformed at 185MPa under triaxial compression. Figure 6 shows HR x-ray images of a vertical projection near the center of the specimen. The top image shows the raw data focusing on high (white) and low (black) density regions in the histogram. A crack initiating from the right notch is apparent. However, by visualizing only this gray level, it is not easy to capture the compaction band. In the middle image, local standard deviation is shown. The more homogenous parts of the specimen appear in red. In fact, a low standard deviation might indicate either pore space or compacting material. Thus, in the bottom image we show both raw data and local standard deviation. The compaction bands are better defined. Moreover, details on low or high density regions as well as on more or less homogenous regions can be defined.
Figure 6. Compaction band in BE6 specimen; a) raw data, b) local standard deviation, c) raw data and local standard deviation superimposed
5. Conclusions
X-ray tomography and 3D DIC have been employed to characterize shear and compaction bands in two different sandstones. HR x-ray images of the Vosges samples depict clearly the shear band, especially when the band is well developed. However the local standard deviation of the x-ray tomography data was used for a better visualization of the compaction band. In the Bentheim sandstone compaction bands could be more easily captured, even by the x-ray tomography gray-level images perhaps because this is a more homogeneous sandstone and because, for the sample considered, the band was well evolved (confirmed by AE data), which was not the case for the Vosges specimen. DIC allowed a qualification of strain (shear or volumetric) and shed light on the mechanisms of the localized features.
6. Acknowledgements
The authors would like to thank P. Charrier, C. Rousseau and D. Takano. G. Dresen is gratefully acknowledged for the financial support of the experiments carried out in GFZ. E-M. Charalampidou is supported by the Ali Danesh scholarship from HWU.
7. References
Bay B. K., “Methods and applications of digital volume correlation”, J. Strain Analysis, vol. 43, 2008, p. 745-760.
Bésuelle P., “Evolution of Strain Localisation with Stress in a Sandstone: Brittle and Semi-Brittle Regimes”, Phys. Chem. Earth, vol. 26, No. 1-2, 2001, p. 101-106.
Hall S.A., Lenoir N., Viggiani G., Desrues J., Bésuelle P., “Strain localisation in sand under triaxial loading: characterisation by x-ray micro tomography and 3D digital image correlation”, 1st Int. Symp. on Computational Geomechanics, 2009, IC2E, p.239-247.
Louis L., Wong T.-F., Baud P., Tembe S., “Imaging strain localization by X-ray computed tomography: discrete compaction bands in Diemelstadt sandstone”, Journal of Structural Geology, vol. 28, 2006, p. 762-775.
Pan B., Qian K., Xie H., Asundi A., “Two-dimensional digital image correlation for in-plane displacement and strain measurements: a review”, Meas. Sci. Technol., vol. 20, 2009, doi:10.1088/0957-0233/20/6/062001.
Stanchits S., Fortin J., Guenguen Y., Dresen G., “Initiation and propagation of Compaction Bands in Dry and Wet Bentheim Sandstone”, Pure appl. Geophys., vol. 166, 2009, p. 843-868.
Viggiani G., Hall S. A., “Full-field measurements, a new tool for laboratory experimental Geomechanics”, Deformation Characteristics of Geomaterials, IOS Press, Atlanta, USA, 2008, p. 3-26.