Strain Field Measurements in Sand under Triaxial Compression Using X-ray CT Data and Digital Image Correlation
ABSTRACT. This paper presents the results of an experimental study on strain localization in soil. The purpose is to characterize in space and time the internal strains and strain localization patterning in a sand undergoing triaxial compression at different confinement pressures. In-situ triaxial tests were conducted on Yamazuna sand at the X-Earth Center (Japan) at different confinement pressures. Complete 3D images of the specimen were obtained at several loading stages throughout the test and analyzed by 3D-volumetric digital image correlation (3D-DIC) in order to obtain 3D incremental displacement and strain fields. Based on the results of XRCT (x-ray computed tomography)/3D-DIC combination, the deformation process and especially the strain localization are quantitatively characterized in space and time under triaxial compression conditions.
KEYWORDS: strain localization, sand, in-situ triaxial test, digital image correlation
1. Introduction
In geotechnical engineering, characterization of the deformation behavior and failure of soils is essential. In particular, for the failure of soils, strain localization is a key issue. In laboratory mechanical testing this can only be investigated through full-field measurements of the displacements and strain in a soil specimen. There are some research activities, which have investigated 3D strain field measurements in granular media including particle displacements (e.g., Yamamoto and Otani, 2001; Nielsen et al., 2003; Hall et al., 2010). In this work, the objective is to characterize the displacement and strain field evolution in a soil under triaxial compression with in-situ (i.e. with x-ray scanning during the loading test) x-ray computed tomography (CT) and Digital Image correlation (DIC). The experimental data analyzed in this work concern a sand of wide grading, for which previously the movements of the larger soil particles have been traced in the CT images (Watanabe et al., 2008). Based on the results of this particle tracking, the 3D displacement fields were obtained for various increments of deformation of the soil specimen and the associated strain fields were calculated using the finite element method. However, the highlighted behavior seems to not truly represent the behavior of the soil because only a restricted number of particles were traced in the CT images.
This paper is concerned with the characterization, using 3D-volumetric DIC, of internal strains and strain localization patterning in a sand undergoing triaxial compression at different confinement pressures. The full 3D fields of displacement and strain are evaluated using x-ray CT and 3D-volumetric DIC. Complete 3D images of the specimens have been recorded at several stages throughout the tests and analyzed by DIC in order to obtain 3D incremental displacement and strain fields. Based on the results of the combined x-ray CT and DIC, the deformation process and especially the strain localization are quantitatively characterized in space and time under different triaxial compression conditions.
2. Summary of test procedure
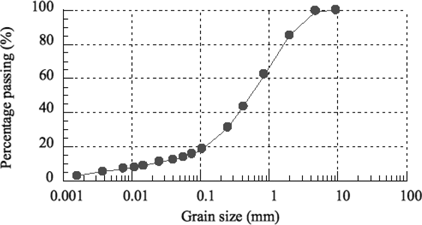
In-situ triaxial compression tests under drained condition were performed on Yamazuna sand at the X-Earth Center (University of Kumamoto, Japan). The specimen was scanned during the test at different levels of loading in order to obtain full 3D images during the process of compression. Figure 1 shows the grain size distribution of this sand in which the minimum particle size was 0.001 mm and the maximum size was 10 mm with a D50 of about 0.5 mm. Note that the grain size distribution was obtained by sieve and sedimentation analysis for particle sizes over and under 75 µm respectively. The specimen size was 50 mm in diameter and 100 mm in height with a dry density of 1.63 t/m3 and Dr=90%.
Figure 1. Grain size distribution
The axial loading rate was 0.3%/min and confining pressures of 50 kPa and 150 kPa were applied in the two tests presented. The scanner used was a Toshiba industrial scanner (see Otani et al., 2002 for details on the scanner and the triaxial test apparatus). For the CT scanning, the voltage used was 150 kV and the electric current was 4 mA. The spatial resolution, i.e. the size of the CT image voxels was 0.073×0.073×0.3 mm3. The specimen was scanned in continuous subsequent sections from bottom to top in order to obtain a 3D image of the whole specimen.
3. Image analysis
DIC techniques have been used increasingly over the last 20 years in studies of the mechanics of a diverse range of materials, including recently geomaterials (Viggiani and Hall, 2008). DIC is essentially a mathematical tool for assessing the spatial transformation between images. The DIC analysis presented in this paper was carried out using the TomoWarp code developed at Laboratoire 3S-R (see Hall et al., 2009 for details). This code is a 3D (volumetric) DIC code providing a 3D volume of 3D displacement vectors between in-situ acquired CT images. Tomowarp follows the same basic steps as most DIC procedures for strain analysis:
1) definition of nodes distributed over the first image;
2) definition of a region centered on each node (the correlation window);
3) calculation of a correlation coefficient for all 3D displacements of the correlation window within an area (the search window) around the target node in the second image;
4) definition of the discrete displacement (integer number of pixels), given by the displacement with the best correlation;
5) sub-pixel refinement (because the displacements are rarely integer numbers of pixels);
6) calculation of the strains based on the derived displacements and a continuum assumption.
4. Results and discussion
4.1. Test results
Figure 2 shows the force-displacement responses from both triaxial compression tests presented here. The annotations on the curve (Initial, A, B, C and D for the 50 kPa test and Initial, 1, 2, 3 and 4 for the 150 kPa test) indicate the moments of the CT scans. Both curves show a similar behavior. First, there is a roughly linear increase that is followed by a curvature to the peak force at around 7%. Then, the force decreases until the end of the test where there is the beginning of a plateau. As expected, the 150 kPa specimen presents a stiffer behavior with higher values of force. Note that there are some stress relaxation phases due to stopping the loading during CT scanning. Most of the relaxation phase occurs almost immediately after the loading is stopped and not over the whole scanning period.
Figure 2. Force-displacement response
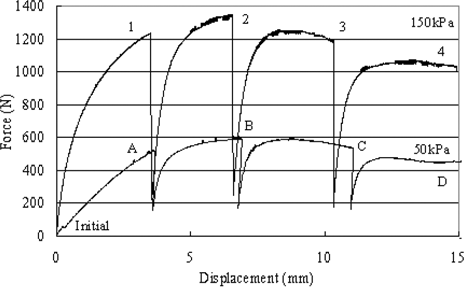
Figure 3, on the next page, shows vertical slices of the middle part of the specimen at each scanning step. These slices are roughly perpendicular to the final plane of localization obtained at the end of the tests. The images from the 50 kPa and 150 kPa tests are presented in the top and bottom part of the figure respectively. In these grey scale images, black represents the air and white represents high-density material. In these images, the spatial variation in the soil density is clear and, due to the wide range of grain sizes and the given spatial resolution, the specimens appear to be a soil with large grains embedded in a matrix of fine grains (smaller than the resolution). Both series of vertical sections along the test show the shortening of the specimen due to the axial loading from the top and the well-known barreling effect caused by the friction at the top and bottom boundaries. For the 50 kPa test, some areas of low density appear at step B (i.e. at the stress peak) in the upper part of the specimen, mainly in the middle and the right and left top corners.
Figure 3. Vertical CT slices through the loading for the 50 kPa test (top) and the 150 kPa (bottom)
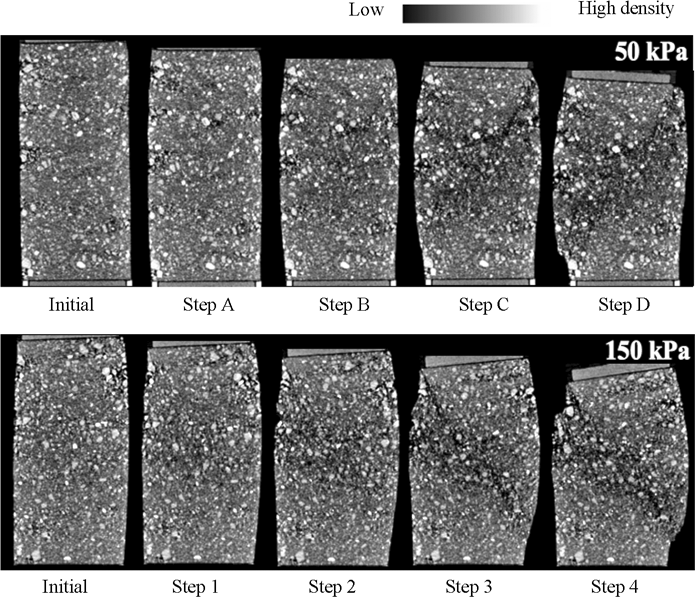
At the next step C, the previous low-density areas in the middle and the right top corner develops and forms one localized low-density band inclined from the top-right to the bottom-left. At the end of the test (i.e. step D) this band is more evident. For the 150 kPa test, the scenario is roughly the same with a low-density zone appearing at the peak stress and developing into an inclined low-density band from the left top to the right bottom. For both tests, the CT images clearly show that only after the peak stress that the strain is localized in a dilative inclined band.
4.2. Digital image correlation results
The CT images were analyzed using 3D-volumetric DIC in order to obtain the full incremental strain field for each load step. Figure 4, on the next page, shows the distribution of the incremental shear strain at a vertical cross section for the 50 kPa (top) and 150 kPa tests (bottom). The section is roughly located at the same place as the vertical slices shown in Figure 3. The white represents a strain greater than 0.3 and black represents no strain. Note that the high strain zones at the boundaries are artefacts of the DIC. For the 50 kPa test, a wide inclined zone of shearing from the left top to the right bottom appears at the increment Initial-A. At increment A-B, just before the peak stress, the shear strain is localized in two crossing bands inclined from the top to the bottom corners. In increment B-C, just after the peak, the shear strain increases in the band inclined from the right corner and decreases in the other one. At the final increment C-D, the shear is only localized in the band from the top-right corner, which corresponds to the band previously observed in the CT images. For the 150 kPa test, the scenario is roughly the same except that only one inclined shear band evolves through the test. The shear strain is localized in a wide, diffuse, inclined zone from the top-left to the bottom-right corners at the increment Initial-1. The zone starts to narrow before the peak (increment 1-2) and even more after with an increase of the shear strain inside the band with an increase in axial loading (increments 2-3 and 3-4). These results clearly show the evolution of the shear strain from two inclined shear bands before the stress peak into a single band after the peak for both the 50 kPa test and for the 150 kPa test. Moreover, it can be seen that the band starts as a wide, diffuse zone and converges to a narrow one in which the shear strain increases with an increase in axial loading.
Figure 4. Distribution of incremental maximum shear strain from DIC at a vertical cross section for the 50kPa test (top) and the 150kPa (bottom)
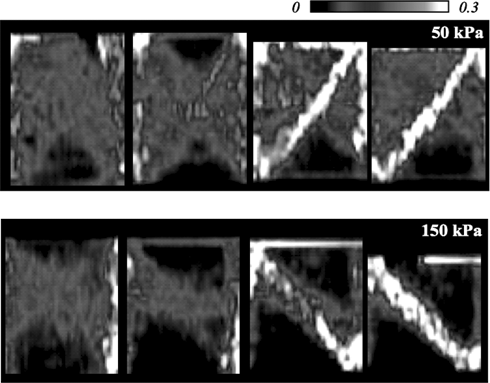
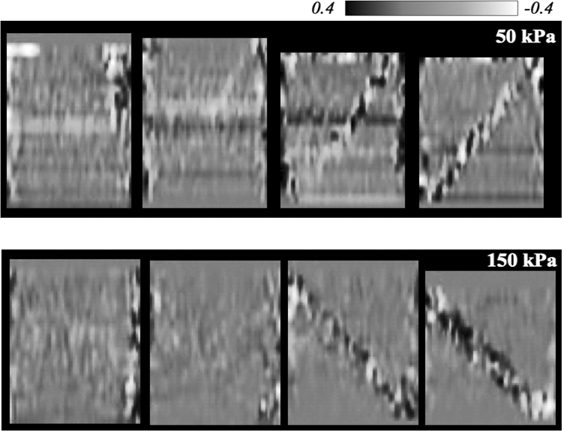
Figure 5 shows the distribution of the incremental volumetric strain at the same vertical cross section position as in Figure 3 for the 50 kPa (top) and 150 kPa (bottom) tests. The white represents a volumetric strain of -0.4 and less (i.e. dilation with the soil mechanics convention) and black represents a compressive strain greater than 0.4 (i.e. compression). Note that the horizontal bands might be an artefact or could be the result of a non-uniform sample deposition. For the 50 kPa test, the volumetric strain indicates dilation as the loading increases. Before the stress peak, in step A-B, two dilating bands have formed in the specimen. After step A-B, it is observed that zones of compression appear in the shear band. At step C-D, zones of dilation and compression exist through the whole of the band. For the 150 kPa test, at steps Initial-1 and 1-2, dilation areas appear in the middle of the specimen. After stress peak, it is observed that compression and dilation areas appear from the top-left to the bottom-right. At step 3-4, dilation and compression occur throughout the shear band as shown in the case of 50 kPa. The results from DIC clearly demonstrate that XRCT is not enough by itself to fully characterize the shear localization process. For instance, the shear band is only detectable in this study after the peak stress once the local volumetric is large enough to be ‘seen’ with XRCT. The combination XRCT/DIC is necessary and is a powerful method to characterize in detail, both qualitatively and quantitatively, the process of shear localization in space and time.
Figure 5. Distribution of incremental volumetric strain from DIC at a vertical cross section for the 50kPa test (top) and the 150kPa (bottom)
5. Conclusions
CT images of a sand under triaxial compression at two different confinement pressures were obtained and analyzed by DIC in order to characterize the strain localization process. Three dimensional incremental strain fields were obtained. Thus, the shear localization process was characterized in detail in space and time. In particular, it has been shown that the shear band starts before the stress peak as a wide, diffuse zone and then narrows into a concentrated shear zone after the peak. Moreover, a certain degree of structure has been observed in the band with alternating of compactive and dilative zones. However, it should be noted that only two tests were analyzed in this paper. More tests in different conditions, such as a wider range of confinement pressure or loading rate, have to be conducted to fully characterize the strain localization in this sand.
6. References
Hall S.A., Lenoir N., Viggiani, G., Desrues J., Bésuelle, P., “Strain localisation in sand under triaxial loading: characterisation by x-ray micro tomography and 3D digital image correlation”, Proc. of Int. Symp. on Computational Geomechanics COMGeo09, 2009.
Hall S.A., Bornert M., Desrues J., Pannier Y., Lenoir N., Viggiani, G., Bésuelle, P., “Discrete and Continuum analysis of localised deformation in sand using X-ray micro CT and Volumetric Digital Image Correlation”, accepted, Géotechnique, 2010.
Nielsen, S.F., Poulsen, H.F., Beckmann, F. Thorning, C. and Wert, J.A. “Measurements of plastic displacement gradient components in three dimensions using marker particles and synchrotron X-ray absorption microtomography”, vol.51, No.8, pp.2407–2415, Acta Materiala, 2003.
Viggiani, G. and Hall, S.A., “Full-field measurements, a new tool for laboratory experimental geomechanics”, pp.3-26, Fourth Symposium on Deformation Characteristics of Geomaterials, IOS press, 2008.
Watanabe, Y., Otani, J., Lenoir, N., Takano, D. and Mukunoki, T. “Visualisation of Strain Field in Sand under Triaxial Compression Using X-ray CT”, vol.56, pp.119-124, Theoretical and Applied Mechanics Japan, 2008.
Yamamoto, K. and Otani, J., “Microscopics observation on progressive failure on reinforced foundations”, vol.41, No.1, pp.25–37, Soils and Foundations, 2001.
