
In Situ Permeability Measurements inside Compaction Bands Using X-ray CT and Lattice Boltzmann Calculations
ABSTRACT. The paper presents some results of the characterization of microstuctural differences inside and outside compaction bands in natural sandstone. Specimens of Aztec sandstone were scanned at the synchrotron APS, at Argonne National Laboratory (USA). Porosity measurements obtained by image analysis show a sharp transition inside/outside the compaction band. Finally, preliminary permeability measurements were conducted via the lattice Boltzmann method and demonstrate the dramatic decrease in permeability caused by the reduced porosity inside the compaction band relative to the host rock.
KEYWORDS: compaction band, sandstone, permeability, lattice Boltzmann, synchrotron
1. Introduction
The study of deformation bands including compaction bands (CB) in granular porous rocks is an important topic for many applications ranging from oil and gas reservoirs to CO2 sequestration to geologic repositories for nuclear waste. For instance, compaction bands have been found in sandstones typical of possible repository host rock for CO2 sequestration. There is the question of how formation, presence or extension of compaction affects the injection of CO2 into reservoirs. Due to the observed dramatic decrease in permeability relative to the host rock (see for a review, Holcomb et al., 2007), CB could play the important role of flow barriers and trap the CO2 injected or, on the other hand, adversely affect injection.
Over the last decade, observations and permeability characterizations in geomaterials have been made at different scales. In particular, lattice Boltzmann (LB) calculations applied to 3D images obtained from X-ray CT have proven to be an efficient method in this area (e.g. Arns et al., 2004, White et al., 2006). However, the method has only been used for characterizing permeability in pristine sandstones without the presence of a CB (e.g. Fredrich et al., 2006). The only LB computation inside of CB was conducted on a simulated 3D image created from a 2D SEM image with a geostatistical model (Keehm et al., 2006). Thus, to our knowledge, this is the first instance of application of these methods to a sample obtained from a CB in the field.
The purpose of this work is to use direct experimental observations and LB calculations to characterize the difference in permeability inside and outside CB obtained from field cores of sandstone. Small specimens of Aztec sandstone cored from the inside and outside of a CB were scanned at a synchrotron in order to characterize the 3D change in microstructure. Porosity was then measured from the images, allowing us to obtain a clear profile of the void-space and observe the transition from the host rock into the CB. From the 3D images, some preliminary permeability measurements were performed using the LB method and show the dramatic effect of CB on the rock’s flow properties.
2. Material and methods
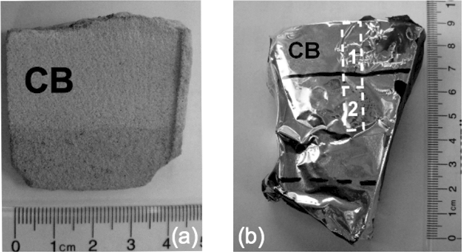
The material studied in this work is Aztec sandstone from the Valley of Fire State park (Nevada, USA) where Sternlof (2006) had conducted a field study of the geometry and physical characterization of the bands. This rock is an eolian sandstone with a mean grain size of about 0.25 mm and a porosity ranging from 15 to 25% (Antonellini et al., 1994). Blocks were taken in the field and small cylindrical specimens were cored with a diamond core drill inside and outside of a CB. In order to prevent disturbance of the microstructure due to the coring process, the block was first impregnated with a low viscosity epoxy. The left part of Figure 1 shows a small block of sandstone with the compaction band appearing in lighter color and on the right, the block used in this study, first impregnated with epoxy. The two white rectangles indicate the location of the cored specimens presented here. Specimen no. 1 was cored inside the CB with the inside/outside CB transition included at its end. The specimen no. 2 was cored just straight ahead of no. 1 outside of the CB. Both were cored in a direction perpendicular to the CB. The specimen diameter is about 4.2 mm. The heights are about 20 and 11 mm for no. 1 and no. 2 respectively.
Figure 1. (a) Piece of Aztec sandstone obtained from the field. The compaction band CB appears in lighter color here; (b) core impregnated of epoxy with the coring location of the 2 specimens presented here
For scanning the specimens, a synchrotron was chosen as it provides the possibility of obtaining a monochromatic beam. This avoids the artefact of beam hardening that can occur with images obtained with laboratory x-ray scanners. Thus, the image segmentation is simplified and makes it possible to obtain a high quality binary image of the microstructure. The specimens were scanned on the DND-CAT 5-BM-C beamline at the Advanced Photon Source, Argonne National Laboratory (USA). The specimens were mounted on a rotating stage by using wax in order to avoid any motion of the sample during the scanning process. The data were collected with a scintillator associated with a CCD camera. The energy used was 25 keV and 1200 radiographies were recorded over half rotation of the specimen, with an exposure time of 725 ms. The spatial resolution was a voxel size of 6×6×6 µm3. The specimens were scanned in different overlapping sequential sections equally spaced (every 3 mm) in order to obtain a full image of the cylinders. The images are 16bit and the volume size for a section was 1299×1299×600 voxels which corresponds to a height of 3.6 mm. The images were then stacked and the final volumes were 800×800×3360 and 800×800×1860 voxels for specimen no. 1 and no. 2 respectively.
3. X-ray CT images and porosity measurements
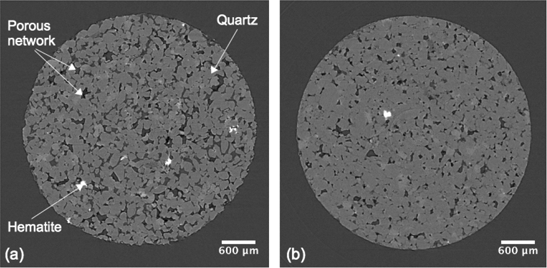
The CT images clearly show the microstructure of the sandstone and the difference in the microstructure inside and outside the CB. Figure 2 presents a horizontal slice obtained from specimen no. 2 on the left and one from no. 1 on the right. Aztec sandstone is mainly composed of round quartz grains (99%) appearing in light gray, and some hematite appearing in white. The porous network mainly filled of epoxy appears in dark gray and black. A packing phenomenon of the grains inside the CB is clearly observed by simple comparison of the images as previously noted by Sternlof (2006) in his field study of CB in Aztec sandstone.
Figure 2. (a) Horizontal CT slice from specimen no. 2. (b) Horizontal CT slice from specimen no. 1
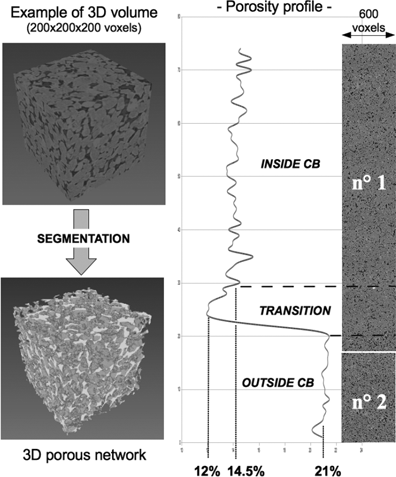
Porosity measurements were performed through image analysis by using the open source software ImageJ (http://rsbweb.nih.gov/ij/). The 16 bit images were first cropped to keep an inner core of 600 voxels width and then converted to binary form in order to measure the permeability. As the grains, especially the boundary grain/pore space, are well defined due to the high spatial resolution, the segmentation was done by a “manual” threshold method. The choice of the threshold value was made as follows. A wide range of gray level values was used and the corresponding porosities were calculated. The obtained profile consists of a linear increase in porosity while within the porous area and a sudden change of slope once the grain boundaries are reached. The onset of this sudden increase was chosen as the threshold value. An example of the obtained 3D porous network after segmentation is shown in Figure 3 on a small volume (200×200×200 voxels) obtained from outside the CB. The mean porosity obtained is about 21% outside and 14.5% inside the CB which is in accordance with the literature (Antonellini et al., 1994; Holcomb et al., 2007). Study of the transition from the CB to the outside material in more detail is possible in the images from specimen no. 1. Figure 3 shows the evolution of the porosity along the continuous specimens no. 1 and no. 2. The transition is very sharp. The porosity decreases from 21% to 14.5% within a zone of approximately 2 mm. Note, however, that within this transition zone is a region of slightly lower porosity (12%). We will perform further studies to determine whether this lower porosity (than with the band itself) is a feature of this particular specimen is more prevalent. If the latter, it may give some insight into factors controlling the width of the band (since it seems to bear no simple relation to the grain size).
Figure 3. Image segmentation and porosity profile inside/outside compaction band
4. Permeability measurements with lattice Boltzmann method
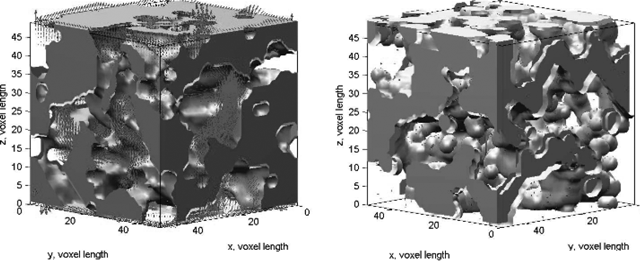
The lattice Boltzmann (LB) method is employed to estimate the permeability of selected sub-domains of the specimen inside and outside the CB. Known for its ability to handle complex geometry, LB method takes advantage of the kinetic theory to seek probability density functions that leads to velocity and pressure fields satisfying momentum and mass balance principles without solving the Navier-Stokes equation directly at the continuum level (Succi, 2001). In this study, the effective permeability is estimated via the procedures described as follows. First, a hydraulic gradient is applied along a basis direction. Then, LB simulations are performed until the pore-fluid velocity field reaches its steady state. Since LB flow is by nature compressible, the permeability corresponding to the basis direction is obtained via Darcy’s law augmented with the continuity equation. Some preliminary simulations were conducted on two small sub-domains (50×50×50 voxels), one inside and one outside the CB, with a measured porosity about 15% and 20% respectively. Figure 4 depicts the obtained simulated flows within the 3D porous network. The permeability along the vertical direction of the sub-domain, i.e. perpendicular to the CB, outside and inside are estimated as kin=1×10⁻¹² m2 and kout=6×10⁻¹⁹ m2 respectively. Such a dramatic change on permeability reflects the geometrical difference of pore space inside and outside the band. Figure 4 suggests that due to the packing phenomenon inside the CB, pore-scale flow channels are likely to be either severely narrowed or completed blocked when a CB forms. Although the difference in porosity between the two sub-domains is about 25%, the results of the LB simulation show that the geometric changes of flow channels triggered by the formation of CB can significantly reduce the flow velocity and cause a low effective permeability.
Note that the obtained ratio in permeabilities kin/kout is about 10−7 which is higher than the one reported in the literature (10−2-10−3) (Sternlof et al., 2004). The smaller ratio obtained here occurs because the calculated permeability is an averaged property having a spatial fluctuation that is larger at smaller scales. LB simulations at a sufficiently large scale would suppress spatial fluctuation but have a high computational cost. The choice for the size of the samples used for permeability calculations is bounded by the minimum size necessary for continuum to make sense and a maximum size imposed by our computational capability. Work is ongoing to parallelize the code and to overcome that limitation of computational cost. Thus, LB simulations will be performed on a large range of volumes in order to determine the elementary volume that will give more representative results of the macroscopic permeability. Moreover, those preliminary results were obtained in a single direction. The anisotropy in permeability will be investigated in a forthcoming publication.
Figure 4. Fluid flow (represented by arrows) within the 3D porous network obtained with LB computation outside (on the left) and inside the CB (on the right)
5. Conclusions and perspectives
We have used synchrotron measurements to obtain detailed 3D images of the microstructure outside and inside a CB formed in the field (Valley of Fire, Nevada). These images are consistent with previous observations of increased grain packing within the band. Porosity measurements made it possible to study the transition from outside of the compaction band to inside in more detail than has been done previously. The porosity decreases sharply, over about 2 mm. A new feature observed here is that within the transition zone, there is a region with porosity slightly lower than within the CB. Further investigation is needed to determine whether this feature is particular to this specimen or more typical of CBs formed in the field. Preliminary permeability measurements obtained using LB method on small volumes outside and inside the CB gave promising results. As anticipated, the reduced porosity in the band results in a dramatic decrease in permeability. Work is ongoing to reduce the computation time in order to perform computations in larger volumes and more samples, which will give more representative results. Moreover, it should be emphasized that this study concerns a single specimen and, though the results are promising, more analysis is necessary to get a faithful picture of the overall hydraulic properties in the context of compaction bands.
6. Acknowledgements
The authors would like to thank P. Eichhubl, University of Texas, for providing the sandstone blocks and D.T. Keane, APS-Argonne Laboratory, for his guidance and help on the scanning process. This work is funded by the U. S. Department of Energy, Office of Basic Energy Sciences, under the project no. DE-FG02-08ER15980. Use of the Advanced Photon Source was supported by the U. S. Department of Energy, Office of Science, Office of Basic Energy Sciences, under Contract No. DE-AC02-06CH11357.
7. References
Antonellini, M.A., Aydin, A., Pollard, A.A. and D’Onfro, P., “Petrophysical study of faults in sandstone using petrophic image analysis and x-ray computerized tomography”, Pure and Applied Geophysics, 1994, vol.143, No.1-3, pp.181–201.
Arns, C.H., Knackstedt, M.A., Val Pinczewski, W. and Martys, N.S., “Virtual permeametry on microtomographic images”, Journal of Petroleum Science and Engineering, 2004. vol.45, No.1-2, pp.41–46.
Fredrich, J.T., Di Giovanni, A.A. and Noble, D.R., “Predicting macroscopic transport properties using microscopic image data”, Journal of Geophysical Research, 2006, vol.111, B03201.
Holcomb, D., Rudnicki, J.W., Issen, K.A. and Sternlof, K., “Compaction localization in the Earth and the laboratory: state of the research and research directions”, Acta Geotechnica, 2007 vol.2, No.1, pp.1–15.
Keehm, Y., Sternlof, K. and Mukerji, T., “Computational estimation of compaction band permeability in sandstone”, Geosciences Journal, 2006 vol.10, No.4, pp.499–505.
Sternlof, K.R., Chapin, J.R., Pollard, D.D. and Durlofsky, L.J., “Permeability effects of deformation band arrays in sandstone”, AAPG Bulletin, 2004, vol.88, No.9, pp.1315-1329,
Sternlof, K.R., Structural geology, propagation mechanics and hydraulic effects of compaction bands in sandstone, PhD Thesis, Stanford University, 2006.
Succi, S., The Lattice Boltzmann Equations, Oxford Science Publications, 2001.
White, J.A., Borja, R.I. and Fredrich, J.T., “Calculating the effective permeability of sandstone with multiscale lattice Boltzmann/finite element simulations”, Acta Geotechnica, 2006, vol.1, No.4, pp.195–209.