
Deformation Characteristics of Tire Chips-Sand Mixture in Triaxial Compression Test by Using X-ray CT Scanning
ABSTRACT. In this paper, the deformation characteristics of a mixture of tire chips and sand are discussed. First a series of drained triaxial compression tests (CD tests) on a rubber sphere specimen and the tire chips specimen was conducted to observe the deformation behavior of a rubber particle aggregate. From the movement of the rubber sphere traced on computer tomography (CT) images, the basic deformation characteristics of the rubber particle aggregate were considered. Then, a series of CD tests on the tire chips and sand mixture was conducted and the changes in the shape of each specimen before and after compression were shown by CT images. Moreover, the Particle Image Velocimetry (PIV) method was applied to CT images scanned during the test, and the deformation characteristics of the tire chips and sand mixture based on the PIV results were shown. The effect that adding tire chips had on the deformation characteristics of the mixture is described while considering the deformability of the rubber particle aggregate.
KEYWORDS: rubber sphere, tire chips and sand mixture, drained triaxial compression test, micro-focus x-ray CT scanner, PIV method
1. Introduction
Since the 1990s, a great deal of research has been conducted on using shredded scrap tires for backfills of quay wall structures (e.g., Edil et al. 2002; Humphrey et al. 1998). Recently many research projects on the beneficial functions of using tire chips to mitigate the effects of earthquakes have been conducted. They include research using a model test of earth pressure reduction on quay wall structures (Hazarika et al. 2006), a numerical simulation to discover the mechanism of this reduction (Kaneda et al. 2007), and a series of undrained cyclic triaxial tests related to the earthquake-proof effect (Hyodo et al. 2007). Kaneda et al. (2007) presented a study showing that earth pressure on quay wall structures was reduced effectively by having a smaller Young’s modulus and Poisson’s ratio and this earth pressure reduction could be achieved with tire chips.
The tire chips and sand mixture form a lightweight soil because of the lower particle density of the tire chips. This soil can be used to help reduce the earth pressure on quay wall structures. On the other hand, the mixture may deform easily against a surcharge because of the deformability of the tire chips. These interactions should be observed by visualizing the deformation features of the mixture.
The main objective of this paper is to examine the basic deformation and shear strength features of a mixture of sand and tire chips. First, in order to observe the basic deformation behavior of a specimen made with homogeneous elastic particles, a series of CD tests were conducted on a rubber sphere specimen. Then a series of CD tests on a specimen consisting of a mixture of tire chips and sand were conducted and the characteristics of shear strength and compressibility of the mixture were observed. These investigations on a rubber sphere and on the tire chips and sand mixture were conducted by using micro-focus x-ray CT scanning.
2. Deformation characteristics of rubber particle aggregate
2.1. Experimental method
A series of CD tests was conducted to investigate the deformation characteristics of a rubber sphere and tire chips during compressive shearing. The particle density of the rubber spheres was 1.270 g/cm3, and their particle size was 8.0 mm. This particle size was selected by referring to a previous study (Holtz et al. 1956). The particle density of the tire chips was 1.150 g/cm3, their mean particle size was 2.0 mm, and the maximum and minimum void ratios were 1.632 and 1.091. The rubber spheres and tire chips were washed with a detergent to remove any impurities adhering to their surfaces and then dried. The diameter and height of both specimens were 5 cm and 10 cm, respectively. The target relative density of the tire chip specimen (TC) was 100%. The number of rubber sphere particles was controlled to 405 when preparing the rubber sphere aggregate (RS). The consolidation pressures used were 30 and 100 kN/m2. The void ratios of the specimen after consolidation were 0.4–0.5 and 0.2–0.3 at consolidation pressures of 30 and 100 kN/m2, respectively in both TC and RS, although the accuracy of the measured void ratios was low because of membrane penetration. The CD tests were conducted with a compression strain velocity of 1.0%/min.
The settings of the micro-focus x-ray CT scanner were as follows: the x-ray power was set to 200 kV, 300 µA; x-ray imaging was used in cone CT (3D-CT) mode; the scanner took 200 images at a time with a slice thickness of 0.5 mm; one slice was a 512 × 512 matrix with a pixel size of 0.12 × 0.12 mm; and the three dimensions of the reconstructed images were 61.44 × 61.44 × 100 mm. The test apparatus was kept in an x-ray shield box during the test and scanning.
2.2. Experimental results
Figure 1 shows the deviator stress-volumetric strain-axial strain relationships of TC and RS. In the cases of RS, these curves followed the same processes during the loading in spite of their cyclic loading between an axial strain of 0% to 10%. The deviator stress of RS was slightly higher than that of TC at the same axial strain at each consolidation pressure. Except in the case of RS consolidated at 30 kN/m2, there were no maximum deviator stresses observed until an axial strain of 23%. From these results, the deformation characteristics of TC and RS were found to be originally similar. The reason for this similarity is that the particle deformability between tire chips and rubber spheres is similar.
Figure 1. Triaxial test results of TC and RS
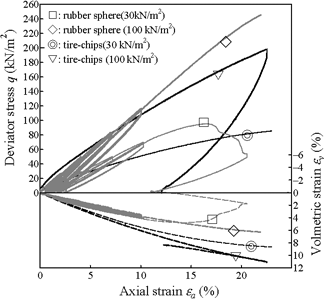
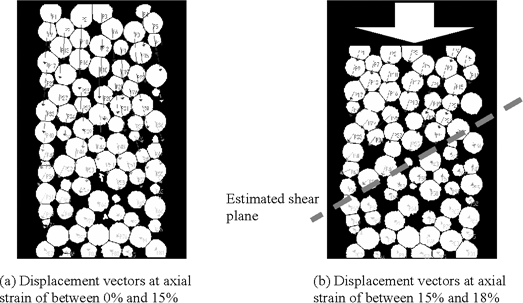
Figure 2 shows the results of the traced movement of each particle in order to observe the deformation mode change of RS during the CD test. The monotonous loading was conducted at a consolidated pressure of 30 kN/m2. Particle displacement vectors during axial strain from 0% to 15% are shown in (a), and those from 15% to 18% are shown in (b). As shown in (a), most particles moved almost vertically up to an axial strain of 15% and the displacement of the particles was large in the upper particles and small in the lower particles. As shown in (b), particles in the upper part moved not only vertically but also horizontally, even though the particles in the lower part seldom moved during axial strains from 15% to 18%. During this observation, a sliding plane was seen, as shown in (b).
This shear deformation produced the deviator stress reduction and dilative volume strain as shown in Figure 1. The dilative deformation was observed only in RS consolidated at 30 kN/m2 as shown in Figure 1. The similarity of the deformation characteristics between RS and TC described above was because of the one-dimensional vertical compression of the particles themselves as shown in Figure 2 (a). Therefore, it is considered that the main deformation mode of tire chips is the compression mode in triaxial compression and that the shear deformation mode is seldom observed.
Figure 2. Displacement vectors during each axial strain of rubber sphere particle
3. Deformation characteristics of tire chips and sand mixture
3.1. Experimental method
Tire chips (ρs=1.150 g/cm3, emax=1.556, emin=1.126, Dmax=2.0 mm), Sohma sand #4 (ρs=2.644 g/cm3, emax=0.970, emin=0.634, D50=0.77 mm, Dmax=2.0 mm), and a mixture of these two materials were used in this series of experiments. The tire chips and Sohma sand were mixed in various proportions. Specifically, the mixing ratios of sand to tire chips by volume were set at 10:0, 7:3, 5:5, 3:7, 1:9 and 0:10. Here, sand fraction (sƒ) indicates the proportion by volume occupied by Sohma sand in the tire chips-sand mixture. Thus, when sƒ =1.0 this indicates a sample consisting of sand only.
The specimen used for the CD test was prepared by moist tamping. The tire chips and Sohma sand were mixed at the prescribed mixing ratio. Water was added to the mixture to obtain an initial water content of w=10%. The diameter and height of the specimens were 5 cm and 10 cm, respectively. The specimen was prepared by arranging the mixture in five layers, with each layer compacted a prescribed number of times by dropping a rammer from a prescribed height. This was done to control the compaction energy so that it reached 50% of the relative density in the specimen of sƒ =1.0.
The same amount of compaction energy was applied to each specimen with a different sand fraction. The specimen was saturated and consolidated at a confining pressure of 50 kN/m2 with a back pressure of 100 kN/m2. The CD test was conducted with a strain velocity of 1.0%/min. CT scanning was conducted at axial strain increments of 2.0% each in all cases.
The settings of the CT scanner different from 2. were as follows: the voltage was 180 kV; the scanner obtained a picture by taking 500 images at a time; the slice thickness was 0.2 mm; the pixel size was 0.15 × 0.15 mm; and the three dimensions of the images were 76.8 × 76.8 × 100 mm.
3.2. Experimental results
Figure 3 (on the next page) shows the relationships among deviator stress, volumetric strain and axial strain during the triaxial tests. The solid lines show the relationship between deviator stress and axial strain. The broken lines show the relationship between volumetric strain and axial strain.
From the stress-strain curves, it can be seen that as the sand fraction increases and the stress increment ratio becomes larger, the strain at the maximum deviator stress becomes smaller. Especially, in the cases of sƒ =0.1 and sƒ=0.0, there was no maximum deviator stress observed until the axial strain reached 20%. Looking at the maximum deviator stress, there was no large difference observed except at sƒ =0.1 and sƒ =0.0. In addition, in terms of compressibility it was observed that the dilative tendency increased as the sand fraction increased.
Figure 4 (on the next page) shows how the internal friction angle ϕ0 and Young’s modulus E50 change with different sand fractions. When the sƒ was larger than 0.3, a small difference was observed in ϕ0, although a large reduction of ϕ0 was observed when the sƒ was less than 0.3. Furthermore, a large difference in E50 was observed between an sƒ of 1.0 and 0.7, but the difference in E50 values between an sƒ of 0.7 and 0.0 was small.
This difference in change in ϕ0 and E50 arose because of the different deformation characteristics of the mixture. E50 is mainly affected by the early stage of compression and at this stage, the deformation characteristics are mainly affected by the compressibility of the tire chips. On the other hand, ϕ0 is affected by the final stage of compression and the final shear strength is mainly affected by the shear resistance of the sand.
Figure 3. Deviator stress - volumetric strain - axial strain relationship of tire chips and sand mixture
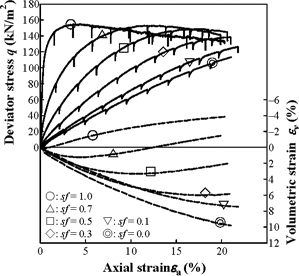
Figure 4. Change in internal friction angle and Young’s modulus with changes in sand fraction
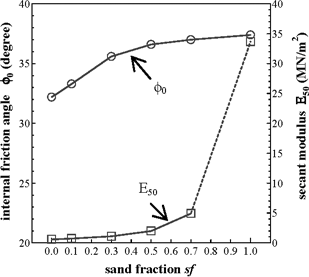
Figure 5 shows the deformation of the specimens before and after compression. This figure shows CT images of the vertical cross-sections on a central axis of the specimen. In the cases of sƒ=0.7, 0.5, 0.3 and 0.1, the images include a dark part and a lighter part.
The dark parts are tire chips and the lighter parts are sand particles. When the specimen was compressed to an axial strain of 20%, the specimen in which sƒ =1.0 deformed into a barrel shape. This kind of horizontal deformation decreases with a decrease in sand fraction and if sƒ =0.1, very little horizontal deformation is observed.
Figure 5. X-ray CT images of vertical cross-sections on a central axis before and after compression
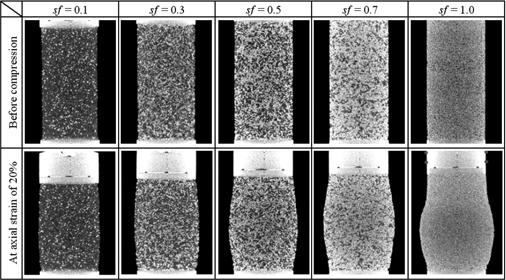
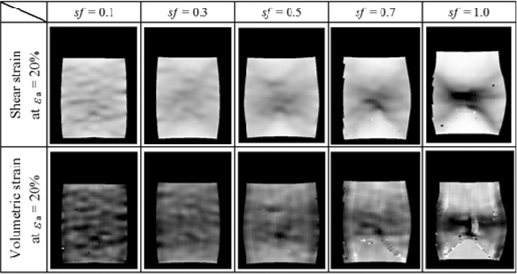
Figure 6 shows the distributions of shear strain and volumetric strain at an axial strain of 20%. The distributions were calculated from the displacement vector analyzed by the PIV method. Shear strain distributions are shown in the upper row, where it can be seen that the shear strain increases as the darkness increases, with almost no shear strain seen in the white part. In the case of sƒ =1.0, a clear shear band was observed at the middle height of the specimen. In this case, no kind of shear zone was clearly observed in the CT image as shown in Figure 5. However, a shear zone was observed by applying the PIV method as shown in Figure 6.
This kind of localization of shear strain became less distinct with decreasing sand fraction. As shown in the cases of sƒ =0.3 and sƒ =0.1, the distribution of shear strain is almost homogeneous and the shear strain is smaller. Volumetric strain distributions are shown in the bottom row, where the color of the initial state is light gray as shown in the part of the wedge in the case of sƒ =1.0. The darker part is more compressed and the white part is more dilated. In the case of sƒ =1.0, the specimen is remarkably compressed at the middle height area, and the dilated part is seen on the boundary of the shear zone and active zone. With decreasing sand fraction, the compressed area increases to the upper and lower parts and the dilated area diminishes.
The tendency for the dilated area to diminish with decreasing sand fraction is expressed well although the accuracy of the dilated area is not exactly high in comparison with the measured volumetric strain. When the active zones are compared with each other in the cases of sƒ =1.0 and sƒ =0.7, the wedge of sƒ =0.7 is compressed. It is considered that shear deformation of the mixture occurs after the specimen is compressed.
Figure 6. Shear strain distribution and volumetric distribution on vertical cross-section on central axis derived from PIV analysis
Based on the results mentioned above, the deformation characteristics of the tire chips and sand mixture are different from those of sand alone. When tire chips are mixed with sand, the Young’s modulus of the mixture is smaller than the Young’s modulus of sand alone. The shear band spreads out and the shear strain becomes smaller with decreasing sand fraction. The tendency of the volume change shifts from dilative to compressive as the compressed area increases. These results show that the deformation characteristics of the mixture are controlled by the compressibility of the tire chips in the mixture as shown in Figure 2(a), more than the shear properties. However, the shear strength and shear resistance of the mixture are quite similar to sand and are affected at the final stage of compression.
4. Conclusions
In this paper, the deformation characteristics of a mixture of tire chips and sand were discussed. Initially, the deformation characteristics of the tire chips were observed independently from the mixture. Based on these observations, it was understood that the main deformation mode of the tire chips is the compression mode during triaxial compression, while the shear deformation mode is seldom observed.
The deformation characteristics of the tire chips and sand mixture are different from those of sand alone. The Young’s modulus of the mixture is very small, the generated shear strain is smaller than that observed with sand alone, and the localization of shear strain diminishes with decreasing sand fraction. The tendency of the volume change shifts from dilative to compressive as the compressed area is increased. However, ultimate shear resistance seldom changes with decreasing sand fraction. This kind of change in characteristics is due to the deformation characteristics of the tire chips, as was shown.
5. References
Edil, T.B., “Mechanical properties and mass behavior of shredded tire-soil mixtures”, Proc. of the International Workshop on Lightweight Geo-Materials, JGS, pp. 17-32, 2002.
Humphrey, D.N., Whetten, N., Weaver, J., Recker, K., Cosgrove, T.A., “Tire TDA as lightweight fill for embankments and retaining walls”, Proc. of Conference on Recycled Materials in Geotechnical Application, ASCE, pp. 51-65, 1998.
Hazarika, H., Kohama, E., Suzuki, H., Sugano, T., “Enhancement of earthquake resistance of structures using tire chips as compressible inclusion”, Report of the Port and Airport Research Institute, Vol. 45, No. 1, 2006.
Holz, W.G., Gibbs, H. J., “Triaxial shear tests on pervious gravelly soils”, ASCE, vol. 82, no. SM 1, pp. 1-22, 1956.
Hyodo, M., Yamada, S., Orense, R.P., Yamada, S., “Undrained cyclic shear properties of tire chip-sand mixtures”, Scrap Tire Derived Geomaterials, Taylor & Francis, pp. 187-196, 2007.
Kaneda, K., Hazarika, H., Yamazaki, H., “The numerical simulation of earth pressure reduction using tire chips in backfill”, Scrap Tire Derived Geomaterials, Taylor & Francis, pp. 245-251, 2007.