
Evaluation of the Efficiency of Self-healing in Concrete by Means of µ-CT
ABSTRACT. It has been estimated that, in Europe, 50% of the annual construction budget is spent on refurbishment and remediation of the existing structures. Therefore, self-healing of concrete structures, which are very sensitive to cracking, would be highly desirable. In this research, encapsulated healing agents were embedded in the concrete matrix in order to obtain self-healing properties. Upon crack appearance, the capsules break and the healing agent is released, causing crack repair. It was found that more than 80% of the original strength could be regained after self-healing. µ-CT was used as non-destructive test method, to visualize the interior of the beams after crack formation. It was shown that after breakage of the capsules, the glue was released from the tubes and sucked into the crack due to the capillary forces.
KEYWORDS: concrete, cracks, self-healing, computed tomography
1. Introduction
Crack formation often appears in concrete because of its low tensile strength. As these cracks may lead to concrete deterioration and reinforcement corrosion, they need to be repaired. Usually cracks are treated from the outside by injection of epoxy or polyurethane resins into the crack. However a lot of labor is needed to restore these cracks; moreover crack repair is practically impossible for some structures, such as buried pipes, undersea structures, foundations, etc.
In this research, autonomous crack healing upon crack appearance is monitored with healing agents that are released from inside the structure. The advantage of this technique is that costs may be reduced and that undetected or unreachable cracks are also treated. Cementitious samples with hollow tubes, consisting of two compartments, that were embedded in the matrix were used for this experiment. Each tube compartment contained one component of a 2-component repair material. When a crack forms, the tubes break and the healing agent flows into the crack. When both components of the healing agent make contact, they polymerize and the crack faces are bound together.
To verify the healing efficiency, cracked samples were subjected to a bending test and the restoration of mechanical properties, due to self-healing, was evaluated. To visualize the interior of the concrete, cone beam micro-computed x-ray tomography (µ-CT) was used as a non-destructive test method. Computed tomography is often used in combination with cementitious materials, mostly to study concrete attack by aggressive liquids or to investigate the microstructure of hydrating cement paste. In this research, µ-CT was used to visualize crack formation and crack repair and to verify the amount of crack filling through the release of the embedded healing agent. Landis et al. (1999) also made use of this non-destructive test method to visualize cracks during a compression test of concrete specimens. In the present study it was not possible to scan the specimens during crack formation, so samples were scanned after cracks were obtained.
2. Materials and methods
2.1. Preparation of the samples
First, the tubes, which were used to carry the healing agent and which were embedded inside the samples, were prepared. The efficiency of glass tubes, each with a different diameter but with the same internal volume, was compared. In Table 1 the dimensions of the tubes are shown.
First the tubes were sealed at one end with glue. Then the compartments were filled with the healing agent which was injected by means of a syringe. In this experiment polyurethane (MEYCO MP 355 1K) was used as healing agent. MEYCO is a low viscous polyurethane that foams upon contact with water or air. As the expanding reaction products occupy a larger volume than the original product, a bigger crack space may be filled. The reaction time of this product may be shortened by addition of an accelerator. Here, one tube compartment was filled with polyurethane and the other tube compartment was filled with a mixture of accelerator and water. When all tubes are filled, the open end was sealed with glue. Then two types of cementitious specimens were made.
Table 1. Dimensions of the tubes used for encapsulation of the healing agent
For the first experiment, cement paste specimens, from which the composition shown in Table 2 was prepared. The samples had dimensions of 25×25×70 mm and were provided with two notches at the side surfaces. Glass tubes with two compartments with an inner diameter of approximately 2 mm were partly exposed to the surface of the specimens for direct observation during crack formation.
Table 2. Composition of the mixes
Subsequently, mortar specimens were made, according to the composition displayed in Table 2. Moulds with dimensions of 60×60×220 mm, provided with a small notch at the lower side, were used. First, a 1 cm mortar layer was brought into the moulds. When this layer was compacted by means of vibration, two reinforcement bars (diameter 2 mm) and two 2-compartment tubes were placed on top of it. Afterwards the moulds were completely filled with mortar and vibrated. For both types of tubes, mentioned above, three specimens, in which the tubes were embedded, were prepared.
After casting, all moulds were placed in an air-conditioned room with a temperature of 20°C and a relative humidity of more than 90% for a period of 24 hours. After demoulding, the specimens were placed in the same air-conditioned room for at least 6 subsequent days.
2.2. Crack formation
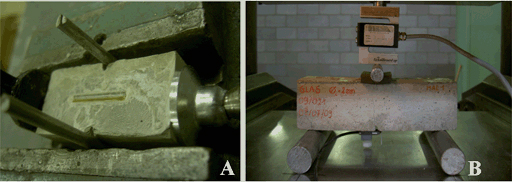
In the cement paste specimens, cracks were created by performance of a splitting test. Two metal rods were positioned in the notches and a splitting force was introduced by means of a bench vice as shown in Figure 1.A. This test was done to prove the sensing and actuation mechanism and is inspired by the experiment performed by Li et al. (1998). As the tubes are partly exposed to the surface, breakage of the tubes and start of the foaming reaction may directly be observed.
The mortar prisms were cracked, and thus the healing mechanism was triggered, by means of a crack width controlled three point bending test. In Figure 1.B, the test setup is shown. Crack widths were measured by means of a linear variable differential transformer (LVDT) with a range of 1 mm and an accuracy of 0.0001 mm. Specimens were subjected to three loading cycles, each time with an interspace of one day. During the first cycle a crack was created and during the second and the third cycle the healing efficiency was evaluated. During each test, the crack width was increased with a velocity of 0.0005 mm/sec until a crack of 0.4 mm was reached. However, during the last cycle, loading was stopped when an additional crack width of 0.3 mm was reached.
Figure 1. Crack formation: (a) performance of a splitting test and (b) performance of a three point bending test
2.3. Evaluation of healing by means of μ-CT
Samples were scanned using the in-house developed μ-CT system of the Center for x-ray Tomography of Ghent University (UGCT). The system is composed of a Feinfocus x-ray tube with tungsten transmission target, a Varian Paxscan 2520 A-Si flat panel detector and a Micos air-bearing rotation stage. For each of the samples a region of 1880×1496 of the detector was used in non-binned mode of 127 µm pixel size and 1,200 projections were taken at 0.3° interval over 360° of rotation. The mortar samples were scanned at 150 kV and 8 W with a spot size of approximately 8 µm and a 2 mm Cu filter. The voxel size of the obtained data is 50 µm. The raw data were reconstructed to CT-slices using Octopus (in-house developed software). The analysis and visualization was performed using Morpho+ and VGStudio.
3. Results and discussion
3.1. Sensing and actuation
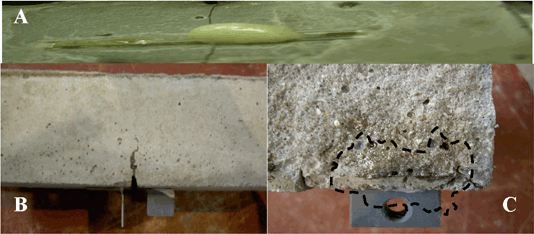
Cement paste prisms were subjected to cracking in a splitting test. Upon crack formation, the glass tubes broke and both components of the glue flowed into the crack due to gravitational and capillary forces. Figure 2(a) shows polyurethane foam that formed when both components made contact. Also in the case the tubes were embedded inside the matrix, evidence was given that the glue leaked out of the tubes. In Figure 2(b) it is seen that, after performance of the bending test, the adhesive entered the crack plane. When all bending tests were fulfilled, cracked mortar prisms were completely broken and the cross-sections were examined. The cross-section shown in Figure 2(c) illustrates visual confirmation of glue flow into the crack plane.
Figure 2. (a) Foaming of polyurethane after breakage of the cement paste specimen, (b) mortar specimen after performance of the three point bending test showing that the glue flowed into the crack and (c) cross-section of a specimen after breakage showing the glue migration (migration front is indicated with a dashed line).
3.2. Regain in mechanical properties
In the graph in Figure 3(a) the crack width is plotted against the load for each of the three loading cycles, to which the mortar prisms were subjected.
The first loading cycle is indicated with the black curve. It is seen that the load increases first until a crack appears in the mortar beam. After reaching the peak load, some distinct drops in load are seen. These may be related to breakage of the tubes as these drops were accompanied with certain “pop” sounds. When the crack reaches a width of 100 µm, the load starts to increase again, this was caused by the reinforcement inside the specimens. When the crack width reaches 400 µm, the specimens are unloaded and the crack width decreases because of the elastic properties of mortar and steel. During the first reloading, indicated with the dark grey curve in Figure 3(a), a new peak is observed, indicating that strength was regained due to crack healing. It is also seen that before the peak load was reached, the curve is steeper compared with the unloading part during the first loading cycle. This indicated that the material regained stiffness.
During the second reloading cycle, indicated with the light gray curve, again a small peak is observed. However this time the peak load is much smaller than during the first reloading cycle, which indicates that during the second reloading a small regain in mechanical properties was obtained.
Figure 3. (a) Load [kN] versus crack width [μm] during crack formation (black curve) and first (dark grey curve) and second (light grey curve) reloading cycle; (b) comparison of the initial strength (black bars) of the mortar beams and the strength after crack healing (first reloading: dark gray bars; second reloading: light gray bars).
In Figure 3(b), the healing efficiency, indicated by the regain in strength, is shown for all test series. Prisms with embedded glass tubes are indicated by means of “GLA” followed by “_2” or “_3” depending on the diameter of the tubes. Suffixes 1, 2 and 3 are used to describe the different specimens of one test series. Test series were subjected to three loading cycles, except GLA_3_1 and GLA_2_3.
Figure 3(b) displays that during the first reloading cycle 30% to 80% of the original strength is regained due to self-healing. The diameter of the tubes seems to play an unimportant role in the extent that strength is regained. This finding conflicts with the expectations that larger diameter tubes would release the glue more easily.
3.3. Amount of crack filling
In order to find an explanation for the counter-intuitive results of the first reloading cycle, μ-CT scans of the samples were performed. Figure 4 illustrates the 3D organization of the mortar, glass tubes, crack and steel reinforcement. The polyurethane has very low x-ray absorption compared to the mortar and steel; it is difficult to distinguish in a quantitative way but it permits qualitative comparison.
Figure 4. 3D CT image of the mortar sample, glass tubes, one of the two steel rods and crack (right). Crack and glass tubes with air and polyurethane displayed together (left)
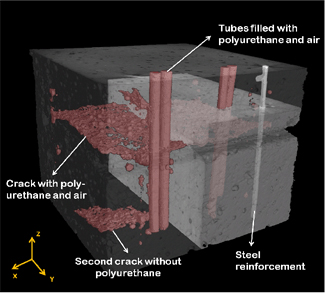
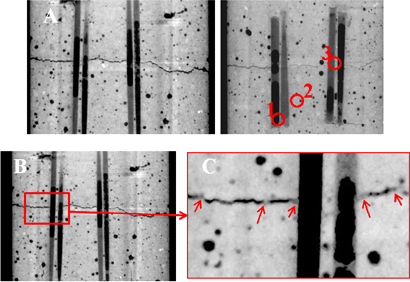
The scans resulted in more than a thousand slices in the Z-orientation, these were resliced in the Y direction (Figure 5) to get a cross-section in the same plane as the four glass tubes. This makes it possible to compare tube drainage efficiency during the formation of the crack and how the polyurethane has infiltrated. It becomes obvious that neither the 2 nor 3 mm tubes have completely been emptied during formation of the crack. The efficiency of the emptying polyurethane is dependent on several parameters, including capillary forces, but the diameter of the glass tubes, either 2 or 3 mm, does not seem to give significant differences in outcome. Polyurethane can be visualized in the tubes as well as in the cracks with μ-CT. Figure 5(c) illustrates a magnified sub-region of a cross-section of the sample with 2 mm tubes. Although the difference in contrast is small, it is clearly visible where polyurethane has filled the crack compared to regions where it has not.
Figure 5. Y-direction μ-CT cross-section through the glass tubes: (a) sample with 2mm diameter tubes, (b) sample with 3 mm diameter tubes and (c) magnified region of interest of the 2mm sample μ-CT data. Filling of the crack with polyurethane is indicated with arrows. Air voids are colored black as indicated by region (1), polyurethane is colored light gray as indicated by (2) and mortar is colored darker gray as indicated by region (3).
4. Conclusions
The proposed technique of using encapsulated healing agents that are embedded inside the matrix may be useful in self-healing of concrete. Bending tests proved that after automated crack healing up to 80% of the initial strength is regained. Computed tomography has proved to be a very useful technique to visualize the interior of the concrete and to evaluate the crack filling by polyurethane by different tube diameters. However, regain in mechanical properties and μ-CT analysis showed no difference in healing efficiency for different tube sizes.
5. Acknowledgements
Financial support from the Research Foundation Flanders (FWO-Vlaanderen) for this study (Project No. G.0157.08) is gratefully acknowledged.
6. References
Landis, E.N., Nagy, E.N., Keane, D.T., and Nagy, G., “Technique to measure 3D work-of-fracture of concrete in compression”, Engineering Mechanics, vol. 125, p. 599-605, 1999.
Li, V.C., Lim, Y.M., Chan, Y-W., “Feasibility study of a passive smart self-healing cementitious composite”, Composites Part B: Engineering, vol. 29, p. 819-827, 1998.