
Quantifying Particle Shape in 3D
Experimental and Mathematical Considerations
ABSTRACT. Quantifying the shape of particles in three dimensions (3D) is important in particle technology. In concrete, the 3D shape of particles like sand, gravel and cement is of great interest for applications including suspension rheology, mechanical properties and realistic microstructure models. When particles are classified as star-shaped, a weaker condition than convexity, a combination of x-ray computed tomography (CT) and spherical harmonic series analysis can quantitatively describe their 3D shape. Since this analysis results in an analytic function for the particle’s surface, one can perform almost any kind of volume or surface integral and so compute many geometrical properties. This paper reviews how 3D particle shape can be measured and analyzed and gives examples for the classes of particles found in construction. Some data will also be given on how particle shape can influence particle size measurement.
KEYWORDS: particle, shape, 3D, spherical harmonics, x-ray tomography, concrete
1. Introduction to particle shape in 3D
The geometry of particles is of interest to researchers in many fields. For regular objects like spheres, cubes, ellipsoids and rectangular boxes, relationships between their dimensions and their shape parameters (e.g. volume, surface area, moment of inertia tensor) have been known for millennia. For a cube or a sphere, a single dimension totally characterizes all properties of the particle. This is not the case for random particles, especially in 3D. It is not hard to define various dimensions for irregular objects – for example, the diameter of the sphere with volume equal to the particles (ESD). However, one length parameter alone cannot define the size and shape of a randomly shaped particle.
The shape of a particle can be important in several ways. In composites, where distinct particles (usually called inclusions) are embedded in a homogeneous phase (usually called the matrix), the particle shape of the inclusion phase can strongly influence the composite properties (Douglas et al. 1995). The percolation properties of the inclusions, as the inclusion packing density becomes higher, also depend on shape (Garboczi et al., 1995). The shape of the solid particles that are suspended in a fluid controls the effective suspension viscosity at a given packing density (Douglas et al., 1995). To accurately model processes where a solid is built up from collections of particles, like in cement hydration in concrete, realistic 3D particle models are required (Bullard et al., 2006). Sometimes, as in the case of Portland cement, particle shape can be linked to particle mineralogy when particles are multiphase and are prepared by mechanical grinding (Erdoğan et al., 2009).
In general, irregular bodies may or may not be convex: a body in which a straight line joining (any) two points in the interior or on the boundary of the body always remains within the body. Most construction particles have some concavities on their surface – especially if they have been crushed – and hence are not convex. A weaker criterion uses the concept of “star shaped”. A star-shaped object requires that all lines that connect the center of volume to any point inside the body (or on its surface) lie entirely within the body. Almost all particles used in the construction industry are star-shaped (Garboczi 2002), as are most geologically-formed particles.
2. Measuring particle shape – experiment and mathematical analysis
The x-ray CT results presented in this paper were collected on two instruments: (1) beamline X2B, at the National Synchrotron Light Source (NSLS), Brookhaven National Laboratory, and (2) on a benchtop instrument located at the National Institute of Standards and Technology (NIST). Pixel sizes down to slightly less than one micrometer were used. Small particles were embedded in epoxy in a cylindrical polymer mold and then scanned. Large particles were mechanically held singly or in some kind of packing so that the particles did not touch each other. The reconstructed image slices were stacked into 3D microstructures consisting of gray scale images of particles embedded in a matrix. A suite of image analysis and error correction software was used to create a clean image of white, separated particles in a black matrix. Custom software was used to extract the particle voxels in 3D (Erdoğan et al., 2006).
The 3D voxel data for a single particle is used to generate the function r(θ,ϕ), which is the distance from the center of volume to the surface in the direction given by the spherical polar angles (θ,ϕ). Spherical harmonic (SH) functions are then used to create a smooth approximation, within the uncertainty of the original x-ray CT image, to the function r(θ,ϕ), using the following expansion for star-shaped particles (Arken, 1970):
[1] ![]()
The star-shaped criterion must be met for this expansion to be valid (Garboczi, 2002). This analytic approximation accurately represents a random-shaped particle and can be used to compute any geometric quantity of the particle like volume, surface area, or moment of inertia (Garboczi, 2002).
A useful set of three orthogonal dimensions for an irregular object, which probably cannot be defined by integrals, is found by directly measuring three dimensions, called length, L, width, W, and thickness, T, defined the following way. One measures the longest line that connects any two points within the body and defines this as the “length” of the body L; the longest such line that is orthogonal to L is called the width W. A similar procedure yields T, which must be orthogonal to both L and T (ASTM D4791). The SH mathematical approximation of the particle can be used in a simple algorithm to find approximations for L, W, and T simply by searching for pairs of surface points that satisfy the length and direction criteria. Often, L = L/T and W = W/T are used and referred to as the normalized dimensions.
3. Examples of particle shape analysis
3.1. Simulated lunar soil
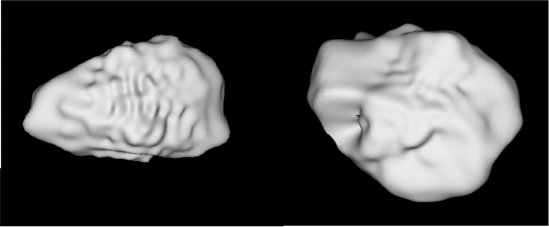
A sample of lunar soil simulant JSC-1A1 (Metzger, 2008) was wet screened with water into four size fractions: (1) particles retained on a 300 µm ASTM screen (+300), (2) those passing the 300 µm screen but retained on a 75 µm screen (75-300), (3) those passing the 75 µm screen but retained on a 38 µm screen (38-75), and (4) those passing the 38 µm screen but retained on a 20 µm screen (20-38). Samples of all four size fractions were embedded in epoxy and formed into cylindrical specimens. A projection algorithm was used to compute the apparent images as would be seen by a 2D optical scanning instrument, which are used commonly to attempt to measure particle shape. Approximately 130,000 particles were measured and analyzed (Metzger et al., 2009). Figure 1 shows two of these particles. The 3D L, W and T dimensions, the moment of inertia tensor, as well as the mean curvature, were computed for each particle, along with many 2D parameters for purposes of comparison with true 3D values.
Figure 1. Virtual Reality Modeling Language (VRML) images of simulated lunar soil particles from two size classes - (left) 20-38 (right) 75-300 (images not to scale)
3.2. Portland cement
Portland cement powder is prepared by grinding 10 mm to 20 mm particles called clinkers down to micrometer size particles. Since the clinkers are multi-phase at the micrometer length scale, so is the resulting powder. The different phases are known to have different hardnesses, so particle phase composition could be related to particle shape. In a study examining eight different Portland cements (Erdoğan et al., 2009), parallel x-ray diffraction studies of particle mineralogy and x-ray CT/SH studies of particle shape found a strong correlation between mineralogy and shape. x-ray CT has also been used to examine the 3D shape of particles in the 20 µm to 60 µm size range (the upper size range for cement), and focused ion beam nanotomography (FIB) has been used to examine the 3D shape of cement particles found in the 0.4 µm to 2.0 µm size range (about the smallest size range for cement) for the same cement (Holzer et al., 2009). Both size ranges were defined by sieving. By comparing various kinds of computed particle shape data for each size class, the conclusion was made that, within experimental uncertainty, the smaller size class particles tended to be marginally more prolate than the larger size class. Figure 2 shows the probability, in terms of number fraction, vs. length and width distributions for both size classes of particles.
3.3. Gravel
Twelve reference rocks, all between 12 mm and 19 mm in size, were extensively studied via x-ray CT and SH analysis (Taylor et al., 2006). Their volumes were measured using Archimedes’ technique, and compared very closely (within 1% to 2%) with the CT/SH technique. Their L, W and T values were also measured with a digital caliper and agreed within experimental uncertainty with the CT/SH values. Several hundred microfine rocks, which passed through a 75 µm sieve but were retained on a 20 µm sieve, were also studied. Several new equivalent shapes, including rectangular boxes and tri-axial ellipsoids, were defined using either the three principal moments of inertia or the L, W and T parameters. Several of these new equivalent shapes proved to be good predictors of particle volume and surface area (as measured at the x-ray CT pixel size).
Figure 2. Histograms for probability (in terms of number fraction) vs. length and width distributions for both (CT, FIB) size classes of cement particles
3.4. Sand
Several ASTM standards for cement and concrete specify the use of “Ottawa sand”, sand that comes from the historic deposits located at Ottawa, Illinois, which have been mined for well over 100 years and are used in laboratories all around North America as the desired sand for many standard tests. For the approximately 2,000 Ottawa sand particles studied in the x-ray CT work, the average value of L = 1.78 ± 0.38 and the average value of W = 1.40 ± 0.28. The uncertainty represents one standard deviation for the average taken over all the particles. Therefore, the average length-to-width ratio of the Ottawa sand investigated was about 1.29. The particles were well-rounded but definitely not spherical. The principal moment of inertia tensor was computed for each particle, and the dimensionless parameter I was defined as the ratio of the maximum principal moment to the minimum. The value of I seemed to vary inversely (but mildly) with particle size, as defined by sieve size.
3.5. Laser diffraction vs. x-ray CT
Laser diffraction particle size analyzers are commonly used for measuring particle size distributions of powders. For a sphere, there is one length that matters – the diameter. However, for a randomly shaped particle, specifying one length does not determine all geometric properties of the particle – including light scattering by the particle. It was of interest, therefore, to look at laser diffraction particle size results and compare the use of the equivalent spherical diameter as determined by light scattering to the use of other dimensions of the particle to characterize the particle “size.” Particles for the light scattering and the x-ray CT experiments were drawn from the same source, with the same kind of sieving. Figure 3 shows the results for four different choices of “size” compared to the laser diffraction “size”: volume equivalent spherical diameter (ESD), and L, W, and T. It appears that using L as the “size” of the particles agrees best with the laser diffraction results (Erdoğan et al., 2007). The label “PF 38-75” indicates the kind of particle and the size class (38 µm to 75 µm as determined by sieving).
3.6. Generating new virtual particles statistically similar to a real particle dataset
Can particles be artificially generated (virtual particles) that are like a given set of real particles in a statistical sense? We have explored this question, first using a dataset of 128 real rocks to statistically generate the SH coefficients for new rocks (Grigoriu et al., 2006). This size dataset was found to be rather small, and so, once the algorithm was converted to parallel mode, much larger datasets of real particles were used (on the order of thousands and tens of thousand). Much better agreement between the shape properties of the virtual particles and the real particles from which they were generated were found (Liu et al., 2009), lending support to the use of this procedure.
Figure 3. Histograms for the probability, in terms of volume fraction, vs. “size” for five different measures of particle
4. Future research
The main research problem at present is not in acquiring and analyzing 3D particle images – these techniques are now well-established and have proven to be very useful – but lies in how to interpret and use the vast array of shape-related data that can now be generated. A precise analytical mathematical representation has been demonstrated for star-shaped particles; enabling practically any surface or volume integral in 3D or 2D (via projection) to be performed and therefore almost any shape-related parameter to be calculated. How does one then use, for example, the principal moments of inertia, or the length, width, and thickness to classify shape? There are very many equivalent shapes that can be generated using these new data – which are the best or most useful? Some attempts to answer these questions have been briefly reviewed in this paper – subsequent progress in the area of particle shape analysis will be made by continuing to address these basic questions.
5. References
Arfken G., Mathematical Methods for Physicists, Academic Press, New York, 1970.
Bullard J.W., Garboczi E.J., “A model investigation of the influence of particle shape on portland cement hydration”, Cement and Concrete Research, vol. 36, 2006, p. 1007-1015.
Douglas J.F., Garboczi E.J., “Intrinsic viscosity and polarizability of particles having a wide range of shapes”, Advances in Chemical Physics, vol. 91, 1995, p. 85-153.
Erdoğan S.T., Quiroga P.N., Fowler D.W., Saleh H.A., Livingston R.A., Garboczi E.J., Ketcham P.M., Hagedorn J.G., Satterfield S.G., “Three-dimensional shape analysis of coarse aggregates: New techniques for and preliminary results on several different coarse aggregates and reference rocks”, Cement and Concrete Research, vol. 36, 2006, p. 1619-1627.
Erdoğan S.T., Fowler D.W., Garboczi E.J., “Shape and size of microfine aggregates: X-ray microcomputed tomography vs. laser diffraction”, Powder Technology, vol. 177, 2007, p. 53-63.
Erdoğan S.T., Nie X., Stutzman P.E., Garboczi E.J., “Micrometer-scale 3-D imaging of eight cements: Particle shape, cement chemistry, and the effect of particle shape on laser diffraction size analysis”, submitted to Cement and Concrete Research, 2009.
Garboczi E.J., Snyder K.A., Douglas J.F., Thorpe M.F., “Geometrical percolation threshold of overlapping ellipsoids”, Physical Review E, vol. 52, 1995, p. 819-828.
Garboczi E.J., “Three-dimensional mathematical analysis of particle shape using x-ray tomography and spherical harmonics: Application to aggregates used in concrete”, Cement and Concrete Research, vol. 32, 2002, p. 1621-1638.
Grigoriu M., Garboczi E.J., Kafali C., “Spherical harmonic-based random fields for aggregates used in concrete”, Powder Technology, vol. 166, 2006, 123-138.
Holzer L., Flatt R., Erdoğan S.T., Bullard J.W., Nie X., Garboczi E.J., “Shape comparison of a cement between nano-focused-ion-beam and X-ray microcomputed tomography”, to be submitted to J. Amer. Ceram. Soc., 2009.
X. Liu, Y. Lu, M. Grigoriu, and E.J. Garboczi, “Spherical harmonic-based random fields for aggregates used in concrete: Further investigation and application”, in preparation (2009).
Metzger P.T., Garboczi E.J., “Three dimensional shape analysis of simulated lunar soil particles” (in preparation, 2009).
Taylor M.A., Garboczi E.J., Erdoğan S.T., Fowler D.W., “Some properties of irregular particles in 3-D”, Powder Technology, vol. 162, 2006, p. 1-15.
1. Material supplied by P.T. Metzger, Kennedy Space Center, Florida, 2008.