
Evaluation of Porosity in Geomaterials Treated with Biogrout Considering Partial Volume Effect
ABSTRACT. This study evaluates the change in porosity of a biogrout specimen using micro-focus x-ray CT scanner and image processing. First, we selected the suitable geomaterials for evaluation of porosity. The results showed that glass beads whose particle size was 0.50-0.71mm were suitable. Second, we calculated the porosity of the glass beads using a method for evaluation of porosity based on a maximum likelihood thresholding method considering the effect of mixels, which are pixels having a two-phase structure. The result showed that the ratio of the porosity of grouted geomaterial to that of ungrouted one was 0.98-0.99, whereas the value estimated by the measurement of changes in concentration of calcium ion was 0.98. Thus, both values closely agreed. Therefore, this study clarifies that the method enables us to evaluate small changes in porosity with great accuracy.
KEYWORDS: porosity, threshold, mixel, biogrout, micro-focus x-ray CT
1. Introduction
Grouting is a technology to inject cementitious and non-cementitious materials into the ground to enhance the strength and/or to reduce the permeability of sands and sandy soils. Recently Portland cement and sodium silicate whose pH is relatively high (e.g. approximately pH=11-12) have been used as the most common compounds in grouting. In contrast, biogrout (Kawasaki et al., 2006) is an eco-friendly grouting technology. It uses microbial metabolism and consists primarily of calcium carbonate (CaCO3), which fills the voids and cracks in soils and rocks. The avoidance of high pH ingredients enables surrounding soils not to be contaminated in the process.
According to the past study, the strength of the biogrouted specimens is about one-tenth part of the expected value (Shoji, 2008). To increase the strength, we needed to increase CaCO3 precipitation. This means, first of all, that we had to quantitatively understand CaCO3 precipitation. That’s why, in this study, we evaluated the change of the porosity caused by CaCO3 precipitation with micro-focus X-ray computed tomography (CT) system and image processing. Additionally, we considered effectiveness of the method for evaluation of porosity.
The biogrouted specimen contains two materials: solid consisting of geomaterial and precipitated CaCO3 and liquid consisting of grout solution. In order to evaluate the porosity, we need the geomaterials whose CT number histogram gained with x-ray CT is bimodal. Based on partial volume effect, the important parameters for the geomaterials having bimodal CT number histogram are as follows: the density and the particle size of geomaterial. Thus, we first selected the geomaterials having bimodal CT number histogram based on this standpoint. Second, we calculated the porosity of the geomaterials by using a method for evaluation of porosity.
As a result, the change of porosity evaluated in this study agreed with the estimated value by the measurement of concentration of calcium ion. Thus, we showed the effectiveness of the method for evaluation of porosity.
2. Methodology
2.1. Selection of the suitable geomaterials for evaluation of porosity
We selected the geomaterials whose CT number histogram gained with x-ray CT is bimodal so that we can set a threshold between liquid and solid and divide these to evaluate the porosity.
Table 1 shows the properties of the geomaterials tested in this study. Specimen preparation is as follows: (1) mix the materials shown in Table 2 to make grout solution; and (2) put this grout solution and geomaterial into a polystyrene container (diameter = 21.0 mm, height = 54.8 mm).
Then, we measured the specimen with the micro-focus x-ray CT scanner (TOSCANER 30900 µhd) made by Toshiba IT & Control Systems Corporation. The scan mode was single slice, and the size of a voxel was 5 µm×5 µm×16 µm. The x-ray tube voltage was 130 kV and x-ray tube current was 62 µA.
Table 1. Properties of geomaterials
| Geomaterials | Density (g/cm3) | Particle size (mm) |
| Souma sand | 2.65 | 0.1 (50% particle size) |
| Gum tips | 1.15 | 2 |
| Plastic pellets | 1.53 | φ3×h4 |
| Steel balls | 7.87 | 1.0 |
| Glass beads 1 | 2.50 | 0.105-0.125 |
| Glass beads 2 | 2.50 | 0.50-0.71 |
Table 2. Constituents of grout solution
| 1M Tris-HCl | 100 (ml) |
| Glucose | 3.0 (g) |
| Calcium nitrate tetrahydrate | 23.6 (g) |
2.2. Data collection for evaluation of porosity
We collected the data for evaluation of porosity with respect to the geomaterials selected in the preceding section. Though it was desirable to use single grouted and ungrouted specimens, we used two different ones to prevent yeast from becoming extinct caused by the first x-ray irradiation of the ungrouted specimen. The grouted specimen was made by mixing yeast into the specimen made in the same way as the preceding section, and then left to rest in an incubator at 25°C. On the other hand, the ungrouted specimen was made in the same way as the preceding section. We mixed no yeast into the ungrouted specimen to prevent the reaction caused by yeast from proceeding. After making the specimens, we imaged them with the micro-focus x-ray CT scanner. The scan mode, the size of voxel and x-ray tube voltage and current were the same as shown in the preceding section. To enhance the reliability, we imaged a total of 12 slices for each specimen.
3. Results
3.1. Selection of the suitable geomaterials for evaluation of porosity
Table 3 shows the histogram type and the suitability for evaluation of porosity of each geomaterial. As shown in Table 3, steel balls and glass beads 2 had a bimodal CT number histogram. Therefore, these geomaterials could be suitable for evaluation of porosity. However, an effect known as beam hardening occurred on the X-ray image of steel balls. Because beam hardening can significantly decrease the accuracy of quantitative results, steel balls were unsuitable for evaluation of porosity. Therefore we selected only glass beads 2 as the suitable geomaterials for evaluation of porosity. Glass beads 2 will hereinafter simply called glass beads.
Table 3. Histogram type and suitability for evaluation of porosity of geomaterials
| Geomaterials | Histogram type | Suitability for evaluation of porosity |
| Souma sand | Monomodal | × |
| Gum tips | Monomodal | × |
| Plastic pellets | Monomodal | × |
| Steel balls | Bimodal | × |
| Glass beads 1 | Monomodal | × |
| Glass beads 2 | Bimodal | º |
3.2. Data collection for evaluation of porosity
Figure 1 shows examples of x-ray image of grouted and ungrouted specimen. The range of white to light-gray color shows glass beads, while the range of black to dark gray color shows solution.
Figure 1. X-ray CT images for each specimen of glass beads
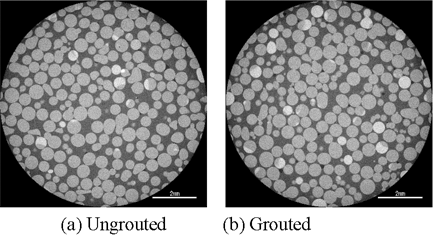
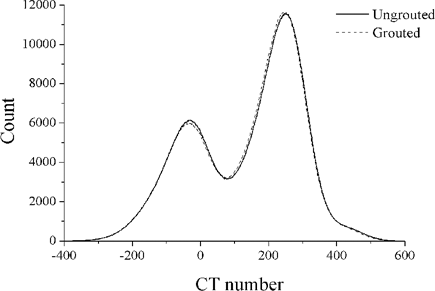
Figure 2 shows the average CT number histogram of measured 12 slices. By a difference in density between glass beads and solution, it can be identified that the left peak in Figure 2 indicates solution and the right peak indicates glass beads.
Figure 2. CT number histogram for each specimen of glass beads
4. Evaluation of porosity
4.1. Thresholding method
To calculate porosity, we needed to set a threshold dividing solid and liquid on the CT number histogram. In this study, we used a thresholding method called “a maximum likelihood thresholding method considering the effect of mixel” (Kitamoto, 1999) to set a threshold properly. A general description of this method is as follows.
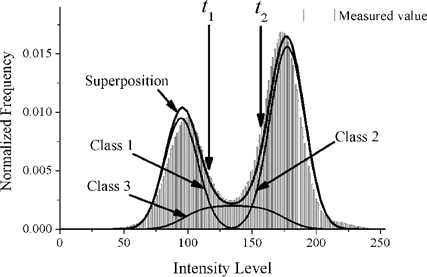
Figure 3 shows the imaging process of a real image. Phase 1 and Phase 2 in Figure 3(a) are different materials. In this study, we can regard liquid as Phase 1 and solid as Phase 2. In the sampling and quantization process, the voxels containing two materials occur as shown in Figure 3(b). Then, the CT number of these voxels has an averaged value based on partial volume effect. Furthermore, in gray level conversion, these voxels have a pixel level that is intermediate between the other two pixel levels (see Figure 3(c)). These pixels, Class 3 shown in Figure 3 (c), are called mixed pixels (mixels) (Kitamoto and Takagi, 1998). In contrast, the others, Class 1 and Class 2 shown in Figure 3 (c), are called pure pixels.
Depending on subjectivity of threshold setter, Class 3 can be divided into both Class 1 and Class 2. Therefore, it is important to take mixel into consideration and not to depend on subjectivity of threshold setter when setting threshold. From these perspectives, this method considers the effect of mixel. This means that it can also take quantization error into account in the imaging process. Additionally, this method calculates threshold from a maximum likelihood. Hence, it can calculate the threshold by a method independent of subjectivity of the threshold setter.
According to this method, superposition shown in Figure 4 measured with x-ray CT can divided into Class 1, Class 2 and Class 3. To divide these three classes, we need two thresholds: t1 and t2. Figure 5 shows thresholds calculated by this method with a measured CT number histogram of a slice of Figure 1(a).
Figure 3. Imaging process of real image
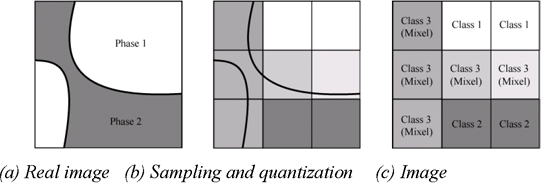
Figure 4. Concept of threshold setting process
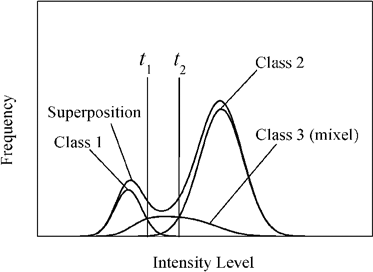
Figure 5. A result of threshold setting
4.2. Calculation of porosity and discussion
We define pure pixels of liquid as Class 1, pure pixels of solid as Class 2 and mixed pixels (mixels) as Class 3. The proportion of liquid and solid in Class 3 stochastically agreed with the proportional of liquid and solid in the entire region of the image. Thus, when α1, α2 and α3 show area occupancy of Class 1, Class 2 and Class 3 respectively, Class 3 can be divided into Class 1 in the proportion of α1α3 / (α1+α2) and into Class 2 in the proportion of α2α3 / (α1+α2). Therefore, porosity can be calculated from the following equation:
[1] ![]()
where φ is porosity.
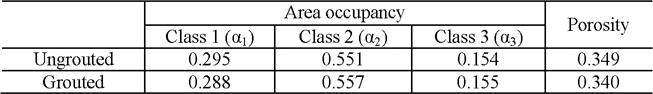
We calculated area occupancy of each class by integration of frequency of each class using the estimated thresholds (see Table 4). Then, we calculated porosity by substitution of calculated area occupancy into equation [1]. Moreover, we calculated average porosity of 12 slices of both grouted and ungrouted specimen (see Table 4). The ratio of average porosity of the grouted specimen (φ2) to that of the ungrouted specimen (φ1) was as follows:
![]()
On the other hand, the ratio of porosity of the grouted specimen (φ2) to that of the ungrouted specimen (φ1) was estimated by the measurement of concentration of calcium ion as follows:
![]()
As shown above, these two values closely agreed. Thus, it was clarified that the method using x-ray CT and a maximum likelihood thresholding method considering the effect of mixel as threshold setting enables us to evaluate the change in porosity with great accuracy. Moreover, from the fact that the method made it possible to evaluate such a small change such as 1-2%, we can expect that it can also evaluate a larger change in porosity.
Table 4. Average area occupancies and porosities for each specimen
5. Conclusion
We have evaluated porosity of biogrouted specimen by using X-ray CT and a thresholding method. Moreover we selected the suitable geomaterials for evaluation of porosity. In conclusion, the following points were made.
- Glass beads whose particle size was 0.50-0.71mm were suitable for evaluation of porosity.
- The method enables us to evaluate small change in porosity with great accuracy.
6. References
Kawasaki, S., Murao, A., Hiroyoshi, N., Tsunekawa M., and Kaneko K., 2006. “Fundamental Study on Novel Grout Cementing Due to Microbial Metabolism”, Jour. Japan Soc. Eng. Geol., vol. 47, no. 1, p.2-12 (in Japanese with English abstract).
Kitamoto, A. and Takagi, M., 1998. “Image Classification Method Using Area Proportion Density that Reflects the Internal Structure of Mixels”, Trans. IEICE, vol. J81-D-2, no.6, p.2582-2597 (in Japanese).
Kitamoto, A., 1999. “A Maximum Likelihood Thresholding Methods Considering the Effect of Mixels”, Technical Report of IEICE, vol. PRMU99-166, p.7-14 (in Japanese with English abstract).
Shoji, H., 2008. Mechanical properties of soil specimens improved by biogrout, Graduation thesis, Hokkaido University (in Japanese with English abstract).