
Trends in CT-Scanning of Reservoir Rocks
Medical CT to Micro CT
ABSTRACT. Converted medical x-ray CT-scanners have been used since 1984 for obtaining important rock and rock-fluid properties in a non-destructive manner for core characterization and fluid flow visualization. Although medical CT-scanners have seen constant improvement in speed, the spatial resolution has not improved from the 350-450 µm range. Typical pore sizes of reservoir rocks vary from less than a micron to a few microns and therefore, the oil industry has been looking for alternatives such as micro and nano CT-scanners. Micro CT-scanners have been used successfully to extract information from cuttings-sized rock fragments and micro CT-based research can potentially eliminate the need for cutting cores. This paper presents a state-of-the-art review of micro CT-based petrophysical research and describes some the techniques used for building realistic pore network models and obtaining various petrophysical properties.
KEYWORDS: CT-scanning, micro CT, cuttings, core characterization, flow visualization, LBM
1. Introduction
Computerized Tomography (CT), introduced in 1972, is a non-destructive medical imaging technique that uses x-ray technology and mathematical reconstruction algorithms to view a cross-sectional slice of an object. With the improvements in speed of data acquisition and resolution, CT-scanners found use in disciplines other than medical radiology and these disciplines include material inspection, material development and evaluation, groundwater hydrology, petroleum engineering, civil engineering and mechanical engineering. In particular, converted medical x-ray CT-scanners have provided the petroleum industry with many important rock and rock-fluid interaction properties in a non-destructive manner since the early 1980s.
The overall petrophysical applications of a CT-scanner can be divided into core characterization and fluid flow visualization. CT-scanners are excellent density/porosity tools. In addition to their qualitative use in identifying formation tops and lithology changes and assessing the condition of preserved whole cores and plugs, CT data are used for depth matching (by comparing with density logs), estimating mineralogy using dual-energy scanning (Wellington and Vinegar, 1987), evaluating heterogeneity, and evaluating fracture volumes – all of which are core characterization applications. As a flow visualization tool, CT has been used successfully to calculate saturations and saturation distributions during multiphase flow processes (Wellington and Vinegar, 1987, Withjack, 1988), to observe flow-related heterogeneities such as viscous fingering, gravity segregation, etc. (Siddiqui et al., 1996), to evaluate pore volume compressibility, to observe wormhole development during acid flow (Bazin and Abdulahad, 1999) or blocking of acid flow by foam. Reviews of the various applications of CT-scanning can be found in the literature (Wellington and Vinegar, 1987, Kantzas, 1990; Akin and Kovscek, 2001 and Withjack et al., 2003).
While medical CT-scanners are still being used heavily in petroleum engineering research, some operational difficulties in obtaining cores, especially from deviated and horizontal wells, are forcing researchers to use micro CT scanners for understanding the underlying conditions that dictate flow in porous media by analyzing rock fragments (or drilled cuttings) – which are automatically generated during the drilling process. Siddiqui et al. (2005) used x-ray CT, x-ray diffraction (XRD), Environmental Scanning Electron Microscopy (ESEM), micro CT, Nuclear Magnetic Resonance (NMR), APEX mercury porosimetry and thin section petrography on cuttings of various sizes generated from a single core plug for which conventional core analysis data such as density, porosity and permeability data were available as a reference. They concluded that below the critical size of 2.5 mm (U.S. mesh size 8), medical CT-scanners fail to provide reliable density and porosity data for cuttings.
Micro CT-scanners, which belong to the industrial CT-scanner group, have been in existence since the early 1980s (Elliott and Dover, 1982). They are used mostly in materials evaluation and inspection and have typical resolutions in the 1-50 micron range. Microtomography, like tomography, uses x-rays to create cross-sections of a 3D-object that later can be used to recreate virtual models non-destructively. Micro CT-scanners are usually smaller in design compared to the medical version and are ideally suited for scanning smaller objects.
2. Petroleum engineering applications of micro CT-scanning
Jasti et al. (1993) were among the first to use a micro CT for petroleum engineering applications using cone-shaped beams. They scanned bead pack, Berea sandstone and chalk samples at a very high resolution and recommended the use of microfocus CT to resolve 3D microstructures present in reservoir rocks and also to characterize flow of multiphase fluids in porous media. Medical CT-scanners, in general, do not have the actual ability to directly observe the pores present within reservoir rocks. Their large focal spots cause “unsharpness” (due to penumbra effects) and therefore, the actual dimensions of features below the scanner’s resolution cannot be ascertained from the medical CT images. For instance, a fine fracture would show as a broad fuzzy line and a small vug can show as a large cavity. The bulk density is usually calculated for a large region-of-interest (ROI) within a core slice by comparing its average CT number with that for a known “standard”, and the density data are then converted to porosity data using appropriate grain and fluid density information. Image subtraction technique can also be used for the direct calculation of porosity from medical CT slices of saturated and dry core plugs (Alvarado et al., 2003).
Micro CT-scanners, which typically have a resolution close to 1 µm, have the ability to “see” the pores in most reservoir rock samples and to distinguish between pore throats, pore bodies and rock grains. The information can then be used for detailed evaluation, modeling and other applications related to multiphase flow dynamics in porous media. In the last few years more and more effort has been put into micro CT-based research using moderate (< 50 µm) to high-resolution (≈ 1 µm) scanners.
Although the resolutions of most commercial micro CT-scanners are sufficient for samples from most sandstone reservoirs, there are very few scanners with resolutions sufficient for sub-micron size pores that are abundant in carbonates. Okabe (2004) proposed to reconstruct image features that are in the sub-micron range by using geostatistical techniques such as multipoint statistics. For these capturing features in the sub-micron range, it may also be worthwhile to use the newly emerging nano-tomography. There is always a tradeoff between resolution and sample size. A higher resolution requires the sample size to be very small. For obtaining one-micron resolution typically the sample has to be about 1 mm in size. Obtaining good images at the one-micron scale can be a challenge. Latham et al. (2008) developed a registration technique to combine low-resolution micro CT data with high resolution SEM image data that can greatly improve the segmentation process used for pore network generation. Recently Grader et al. (2009) conducted micro-CT based core panoscopy, or multi-scale imaging experiments and remarked that in heterogeneous rocks such as carbonates, proper digital rock physics may require even five or six registered resolutions to define mechanical and transport properties of core samples.
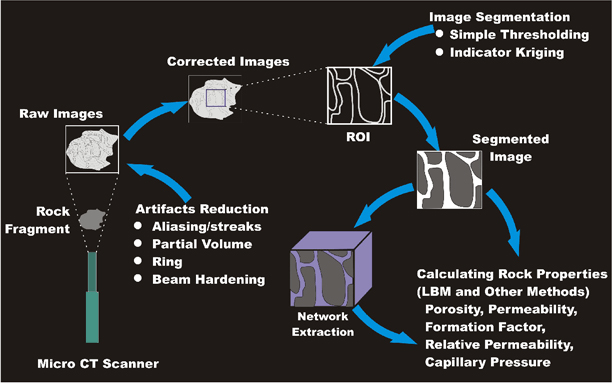
3. Typical workflow for determining petrophysical properties using micro CT
The first step in the determination of petrophysical properties from rock fragments is to acquire micro CT images. The raw images from micro CT-scanners may contain different image artifacts. They include the aliasing artifact (or streaks), the partial volume artifact, the ring artifact and the beam-hardening artifact. Several pre-processing and post-processing routines are available to minimize or eliminate these artifacts. After the artifacts are removed, the images need to go through some additional image processing before pore networks can be extracted. These generally include 3D cropping, and segmentation using either simple thresholding or indicator kriging (Oh and Lindquist, 1999). Some “cleaning” algorithms are available for removing isolated phase blobs. Segmentation is required to separate the rock and pore phases from the CT-scan images. Pore networks are generally extracted using either the medial axis (Lindquist et al., 1996) or the maximal ball algorithm (Silin et al., 2004). Figure 1 is a typical workflow diagram for using micro CT data for calculating important reservoir properties such as porosity, absolute and relative permeability, formation factor, capillary pressure, etc. through pore network modeling.
Porosity is calculated by dividing the total number of voxels representing pores by the total number of voxels representing the sample. Porosity calculation and pore network extraction is very subjective and depends on the threshold values used. Absolute permeability is generally determined from the image by solving Stokes’ Law in discretized domain obtained readily from the digitized image. The Lattice-Boltzmann Method (LBM) is commonly applied as a solution technique (Auzerais et al., 1996). Arns et al. (2001) calculated formation factor directly from microtomographic images of Fontainebleau sandstone. They selected Fontainebleau sandstone as it is homogenous, made up of a single mineral (quartz), does not contain clay and only displays irregular porosity. They assigned a conductivity value of 0 to the matrix phase of the sandstone and a normalized conductivity value of 1 to the pore phase. The conductivity calculation is based on a solution of the Laplace equation with charge conservation boundary conditions. To compute relative permeability from CT images, Auzerais et al. (1996) used a simulation technique based on a 3D immiscible lattice-gas model and they considered a two-fluid model where one fluid perfectly wets the solid boundaries and the viscosities and densities in each fluid are equal. They obtained a very good match for the end-point relative permeability values but did not get good results at other saturations. Arns et al. (2003) calculated relative permeability using the theory as given by Øren et al. (1998). Both Auzerais et al. and Arns et al. (2003) concluded that producing meaningful multiphase transport parameters would require considerably larger networks. To calculate capillary pressure curves from micro-CT images, Jin et al. (2007) assumed that the rock is water-wet and the wetting phase (water) occupies the corners of the large pores and small pores while the non-wetting phase (oil) occupies the central parts of the invaded pores. To assign spatial fluid distribution in the pore space, they implemented a simple percolation algorithm. They calculated fluid saturations from the calculation of the volumes occupied by each fluid phase at a given capillary pressure and then plotted the capillary pressure curve.
Figure 1. Typical workflow used in micro CT-based pore network modeling
4. Results for carbonate reservoir data
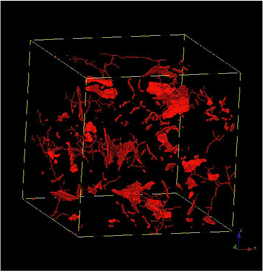
High-resolution micro CT data from a small rock fragment from a carbonate reservoir was used to generate a segmented image shown in Figure 2. The image shown represents a volume of about 0.6 mm × 0.6 mm × 0.6 mm (length of each voxel is about 0.2 µm in a 2563 matrix) and the porosity is about 17%. The 3DMA Rock software was used to generate cleaned segmented image (Figure 3), medial axis (Figure 4) and pore throat distribution data (Figure 5). Lattice-Boltzmann simulation was then conducted to generate permeability data in three orthogonal directions and the values were 358, 642 and 358 mD, respectively. Although data were available for 5123 and 10243 on the same rock fragment, the Lattice-Boltzmann simulation could not be run with those because of hardware and software limitations. Faster processors and parallel processing codes may improve the situation, especially for determining the multiphase flow parameters such as relative permeability and capillary pressure, which require more computational power.
Figure 2. Segmented image
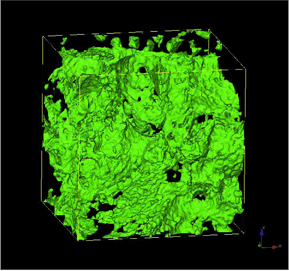
Figure 3. Cleaned segmented image
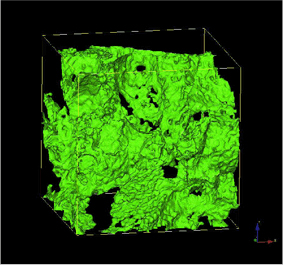
Figure 4. Medial axis
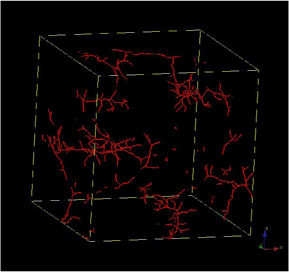
Figure 5. Pore throat distribution
5. Discussion
In recent years, mainly due to the interest of the oil industry in eliminating coring and obtaining most of the static and dynamic petrophysical parameters from drilled cuttings, lot of research efforts have been directed towards micro CT-based pore network modeling. Significant progress has been achieved in network extraction and petrophysical property prediction. There has been limited success so far in validating the pore network-based parameters, especially those related to multiphase flow and there is a need for conducting more research in this area. Having better models for predicting various rock related parameters from small rock fragments and having the ability to solve simulation problems for larger networks are two more important areas of research. Ultimately upscaling of all the pore network model generated data will become another focus area for research.
6. Acknowledgments
The authors acknowledge the High Performance Computing Center (HPCC), Texas Tech University for providing its Grendel cluster resources for this study. The authors also acknowledge Dr. W.B. Lindquist (SUNYSB), Dr. R. Vadapalli (TTU) and Mr. S. Addepalli (TTU) for their help with the computational part of this work.
7. References
Akin, S. and Kovscek, A.R., “Use of Computerized Tomography in Petroleum Engineering Research”, Annual Report of SUPRI TR 127, Stanford University, Stanford, CA, August 2001, pp. 63-83.
Alvarado, F., Grader, A.S., Karacan, O. and Halleck, P.M., “Visualization of Three Phases in Porous Media Using Micro Computed Tomography”, SCA 2003-21, presented at the International Symposium of the Society of Core Analysts held in Pau, France, September 21-24, 2003.
Arns C.H., Knackstedt, M.A., Pinczewski, W.V., Lindquist, W.B., “Accurate Estimation of Transport Properties from Microtomographic Images”, Geophysical Research Letters, Vol. 28, 2001, pp. 3361-3364.
Arns, J-Y., Arns, C.H., Sheppard, A.P., Sok, R.M., Knackstedt, M.A. and Pinczewski, W.V., “Relative Permeability from Tomographic Images; Effect of Correlated Heterogeneity”, Journal of Petroleum Science and Engineering, Vol. 39, 2003, pp. 247-259.
Auzerais, F.M., Dunsmuir, J., Ferreol, B.B., Martys, N., Olsen, J., Ramakrishnan, T.S., Rothman, D.H., Schwartz, L.M., “Transport in Sandstone, A Study Based on Three Dimensional Microtomography”, Geophysical Research Letters, Vol 23, No 7, April 1996, pp. 705-708.
Bazin, B. and Abdulahad, G., “Experimental investigation of some properties of emulsified acid systems for stimulation of carbonate formations”, SPE 53237 presented at the SPE Middle East Oil Show held in Bahrain, February 20–23, 1999.
Elliott, J.C. and Dover, S.D., “X-ray microtomography”, Journal of Microscopy, Vol. 126, 1982, pp. 211-213.
Grader, A.S., Clark, A.B.S., Al-Dayyani, T. and Nur, A., “Computations of Porosity and Permeability of Sparic Carbonate Using Multi-Scale CT Images”, SCA 2009-31, presented at the International Symposium of the Society of Core Analysts held in Noordwijk, The Netherlands, September 27-30, 2009.
Jin, G., Torres-Verdın, C., Radaelli, F., Rossi E., “Experimental Validation of Pore-Level Calculations of Static and Dynamic Petrophysical Properties of Clastic Rocks”, SPE paper No. 109547, presented at the ATCE 2007 Technical program held in Anaheim, CA, 11 – 14 November, 2007.
Jasti, J.K., Jesion, G. and Feldkamp, L., “Microscopic Imaging of Porous Media with X-ray Computer Tomography”, SPE Formation Evaluation, September, 1993, pp.
Kantzas, A, “Investigation of Physical Properties of Porous Rocks and Fluid Flow Phenomena in Porous Media Using Computer Assisted Tomography”, In Situ, Vol. 14, No. 1, 1990, p. 77.
Latham, S., Varslot, T. and Sheppard, A., “Image Registration, Enhancing and Calibrating X-Ray Micro-CT Imaging”, SCA 2008-35, presented at the International Symposium of the Society of Core Analysts held in Abu Dhabi, UAE, October 29-November 2, 2008.
Lindquist, W.B., Lee, S.-M., Coker, D.A., Jones, J.W. and Spanne, P., “Medial Axis Analysis of Void Structure in Three-Dimensional Tomographic Images of Porous Media”, Journal of Geophysical Research, 101B, (1996), pp. 8297-8310.
Oh, W. and Lindquist, W.B., “Image Thresholding by Indicator Kriging”, IEEE Transactions on Pattern Analysis and Machine Intelligence, Vol. 21, (1999), pp. 590--602.
Okabe, H., Pore Scale Modelling of Carbonates, PhD dissertation, Imperial College, London, UK, June 2004.
Øren, P.E., Bakke, S. and Arntzen, O.J., “Extending predictive capabilities to network models”, Society of Petroleum Engineers Journal, Volume 3, Number 4, December 1998, 324-336 pp.
Siddiqui, S., Hicks, P.J. and Grader, A.S., “Verification of Buckley-Leverett Three-Phase Theory Using Computerized Tomography”, Journal of Petroleum Science and Engineering, Vol. 15, 1996, pp. 1-21.
Siddiqui, S., Grader, A.S., Touati, M., Loermans, A.M. and Funk, J.J., “Techniques for Extracting Reliable Density and Porosity Data from Cuttings”, SPE paper No. 96918, presented at the 2005 SPE Annual Technical Conference and Exhibition held in Dallas, Texas, 9-12 October 2005.
Silin, D.B., Jin, G., Patzek, T.W., “Robust determination of the pore-space morphology in sedimentary rocks”, Journal of Petroleum Technology, Vol. 56, No. 5, 2004, pp. 69-70.
Wellington, S.L. and Vinegar, H.J., “X-Ray Computerized Tomography,” Journal of Petroleum Technology, August, 1987, p. 885.
Withjack, E.M., “Computed Tomography for Rock-Property Determination and Fluid-Flow Visualization”, SPE Formation Evaluation, December, 1988, p.696.
Withjack, E.M., Devier, C. and Michael, G., “The Role of X-Ray Computed Tomography in Core Analysis”, SPE 83467 presented at the SPE Western Regional/AAPG Pacific Section Joint Meeting held in Long Beach, California, May 19-24, 2003.