
Visualization of Strain Localization and Microstructures in Soils during Deformation Using Microfocus X-ray CT
ABSTRACT. It is well known that strain localization is an important issue for the onset of failure problems. In order to clarify the mechanism of failure, it is necessary to visualize the strain localization and microstructure changes in detail. The aim of this paper is to observe strain localization behavior and microstructures of soils during deformation process using a microfocus X-ray CT. Strain localization of unsaturated Toyoura sand specimen and Maruyamagawa clay specimen during compression tests have been observed and discussed. In addition, microstructures of sands have been visualized by partial CT scan. In the partial CT images, we can clearly visualize each soil particle distinguished from the others.
KEYWORDS: strain localization, microstructure, microfocus X-ray CT, unsaturated sand, clay
1. Introduction
It is well known that the microstructure such as arrangement of soil particles and void distribution is a key to understand the strain localization and failure of geomaterials. The strain localization of geomaterials has been studied by many researchers since the strain localization phenomenon is an important issue for onset of failure problems. For partially saturated soil, the pore water exists as meniscus with suction force which behaves as capillary force between the soil particles. The water meniscus strengthens the soil as a capillary force while the collapse of the water meniscus causes drastic loss of strength by shearing or infiltration of water.
Strain localization of geomaterials has been studied by many researchers. In particular, investigations using x-ray CT have achieved a lot of outcomes (e.g. Desrues et al. 1996; Alshibli et al. 2000; Otani et al. 2000; Kodaka et al. 2006), and, recently, microstructure changes due to shearing have been studied by micro computed tomography (e.g. Oda et al. 2004; Kikuchi 2006; Matsushima et al. 2006). To the author’s knowledge, however, the published researches are mainly for dry sand although most of the natural geomaterials are fully saturated or unsaturated porous media.
In the present study, strain localization and microstructures in unsaturated sand and clay were investigated using a microfocus x-ray CT. The microfocus x-ray CT system used in this study has very small focus size and has high voltage and current; hence, it is possible to visualize the microstructures in rather larger specimens with high spatial resolution. In addition, since the triaxial cell can be mounted on the rotation table, x-ray CT scan during triaxial compression tests can be performed. In the present paper, using the microfocus x-ray CT, visualization of the strain localization and microstructure during compression tests for unsaturated Toyoura sand and Maruyamagawa clay specimens were conducted. Moreover, we have performed partial CT scan with very high magnification for sand specimens, in order to visualize each sand particle distinguished from others, i.e. the microstructures of sand specimens.
2. Microfocus x-ray CT
In this study, we used a microfocus x-ray CT system, TOSCANER-32250µHDK assembled by TOSHIBA IT & Control Systems Corporation, which was newly introduced in Dept. Civil & Earth Resources Engineering of Kyoto University. The specification of the system is listed in Table 1. The focus size of the microfocus x-ray tube is very small, 4 µm, which provides very high spatial resolution of 5 µm. The system also has a high penetrating ability with the maximum voltage of 225 kV and the maximum current of 1 mA. The voltage and the current can be controlled independently and the maximum electric power consumption is 200 W.
Figure 1 depicts a schematic figure of the microfocus x-ray CT system. The microfocus x-ray tube generates a cone shape of white x-ray beam. A two dimensional x-ray image intensifier (I.I.) records the x-ray attenuation at different angles equally spaced 360° by rotating the object on a computer-controlled rotation table (rotate-only method). The x-ray I.I. converts an X-ray photon to visible light, and then the light is transformed to the digital data by a CCD camera. Using the data, the computed tomography technique provides a spatial distribution of CT value with a gray scale, i.e. CT image. The total number of the colors is 256.
Table 1. Specifications of the microfocus X-ray CT
| X-ray source | Maximum voltage | 225 kV |
| Maximum current | 1 mA | |
| Maximum electric power consumption | 200 W | |
| Min. focus size | 4 µm | |
| Maximum projection views | 4,800 (0.075°) | |
| Maximum accumulation per 1 view | 50 | |
| Work table | Maximum size of specimen | φ700 mm, h700 mm |
| Maximum scanning area | φ200 mm | |
| Maximum weight of specimen | 441 N (45 kgf) | |
| Image Intensifier | Size of detector | 9/6/4.5 inch |
| Image matrix | 5122/10242/20482 | |
| CT image | Spatial resolution performance | 5 µm |
| Scanning method | single scan (2D CT image)/ cone-beam scan (3D CT image) |
Figure 1. Schematic diagram of the microfocus X-ray CT
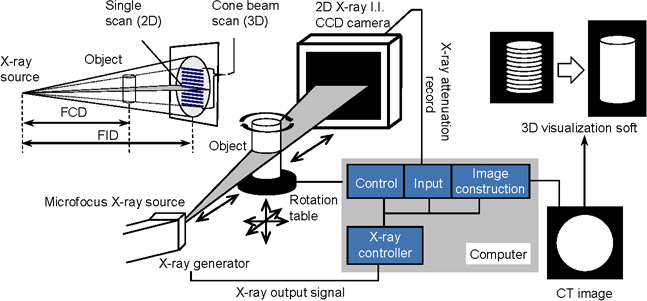
The cone beam technique gives several horizontal CT images in the vertical direction with one scanning. Finally, we can obtain a complete three-dimensional CT image constructed by a visualization software (VGStudio MAX2.0, Volume Graphics GmbH). The distance between the x-ray source and the rotation table (FCD) and that between the x-ray source and the x-ray I.I. (FID) can be changed manually so that the magnification can be determined arbitrarily. The magnification also depends on the x-ray image intensifier with the user-selectable size of 4.5, 6 and 9 inches in diameter. In addition, since the triaxial cell can be mounted on the rotation table, the specimens during triaxial tests can be scanned.
3. Visualization of strain localization in soil specimens
3.1. Unsaturated sand during triaxial compression tests
The test sample used in this study was Toyoura sand which is classified as semi-angular sand. The average diameter D50 was 0.185mm, the uniformity coefficient was 1.6, the maximum void ratio was 0.975, the minimum void ratio was 0.614, and the fine content was 1%.
The specimen was prepared by the moist-tamping method using a rammer and a mould. Prior to performing the compaction, the dry Toyoura sand and the water were mixed; the initial water content was 8.14%. Then, the mixed wet Toyoura sand was compacted in several layers in a cylindrical mould with 35 mm in diameter and 70 mm in height. The initial void ratio is 0.66 and the relative density is 87%. The triaxial cell used in the present study was made by lucid acryl so that x-ray attenuation by the triaxial cell is as small as possible. Minus 20kPa of air pressure was applied inside the specimen as a confining pressure during the compression test, while the cell pressure was equal to atmospheric pressure. Hence, this test was carried out under drained conditions for water and air. After setting the specimen, the triaxial cell was placed on the rotation table. Axial pressure was loaded by displacement control system of DC servomotor. The applied axial strain rate was 0.5%/min.
The specimen was scanned at four different steps: initial state, before and after the peak deviator stress, and after visible formation of shear bands. Cone-beam CT method has been used for scanning, in which the voltage is 150 kV, the current was 200 µA, the size of the x-ray I.I. was 6 inch, the number of projection views was 1200, the accumulation per one view was 10, the matrices of image was 1024×1024, and the voxel size was 41 µm × 41 µm × 300 µm
The stress-strain relation obtained by the test is demonstrated in Figure 2. The specimen exhibits strain-hardening behavior until an axial strain of 5.5%, and then it shows strain-softening. At an axial strain of 15%, shear bands developed clearly enough to be visible by naked eyes. We have scanned at four stages: at the initial state, before the peak stress, after the peak stress, and after the visible formation of shear bands. At each stage the axial loading was stopped just before the scanning, and then the specimen was scanned, namely, the axial strain was held constant during the scanning. Every scanning in this study spent about two hours; hence, stress relaxation can be seen in the stress-strain relation. After the scanning, axial loading was restarted with the same axial strain rate.
Figure 2. Stress-strain relation and the scanning steps (Toyoura sand)
Figure 3. Cross-sections of CT image
Figure 4. Horizontal and vertical CT slices of Toyoura sand at four stages during triaxial compression test: (a) initial state, (b) before peak (axial strain of 5%), (c) after peak (axial strain of 8%), and (d) after visible shear bands formation (axial strain of 15%)
Figure 4 shows reconstruction of CT images at four different stages. In the CT images, darker regions denote lower densities and lighter regions denote higher densities. The location of the sections is illustrated in Figure 3.
At the initial state several curved lines at almost equal distance can be seen in the vertical sections, and circular line appears in the image of xy5 section. These lines correspond to the boundaries between compaction layers. The lower density region at the center of the specimen can be seen before the peak stress, at an axial strain of 5%. This is because the volume expansion due to dilatancy occurs in the specimen.
After the peak stress, shear bands can be seen in the lower part of the specimen in the CT image at an axial strain of 8% although the shear bands could not be seen with naked eyes. The localization pattern involves two types of shear band, which is similar to that observed in air-dried sand by Desrues et al. (1996) (one of them is an axial conical band and the other is a radial-planar band).
3.2. Water-saturated clay during unconfined compression test
The clay used in this study was Maruyamagawa clay sampled at Kyoto Pref., which was almost fully saturated and very soft clay: the wet density was 1.545 g/cm3, natural water content was 64.99%, the degree of saturation was 99.4%, and the initial void ratio was 1.6. The clay sample was trimmed to be a cylindrical specimen with 35 mm in diameter and 70 mm in height. Then the specimen was put into the triaxial cell same as above, but no confining pressure was applied, namely, this test was conducted under the unconfined compression conditions. The axial strain rate was 0.5%/min.
Figure 5. Stress-strain relation and the scanning steps (Maruyamagawa clay)
Figure 6. Horizontal and vertical CT images of Maruyamagawa clay at four steps during unconfined compression test: (a) Initial state, (b) Axial strain of 4%, (c) Axial strain of 10%, and (d) Axial strain of 13%
The stress-strain relation is shown in Figure 5. X-ray scanning at four steps was carried out as shown in Figure 5. The CT image demonstrates that the density of the lower part of the specimen was smaller than that of the upper part at the initial state; however, initial cracks can be seen in the upper part while the lower part was rather homogenous; shown in Figure 6. It can be seen in Figures 6(b), 6(c), and 6(d) that the initial cracks trigger the strain localization and the shear band develops in the downward direction.
4. Microstructures in sand specimens
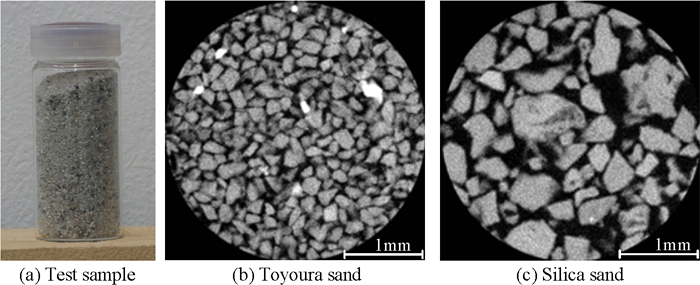
In order to visualize microstructures in sand specimen, we performed a partial CT scan by which the volume of interest of the specimen was partially scanned non-destructively. The partial CT scans for Toyoura sand with D50 of 0.185 mm and Silica sand with D50 of 0.372 mm were performed. The voltage was 150 kV, the current was 200 µA, the size of the detector was 4.5 inch, the projection views are 2400, the accumulation was 20, the matrices of image was 2048 × 2048, and the voxel size was 1.7 µm × 1.7 µm × 52 µm. The sand sample was dropped into a glass bottle with 32 mm in diameter as shown in Figure 7(a), then placed on the rotation table and was scanned by an x-ray fan-beam.
Figures 7(b) and 7(c) show images of microstructures constructed by microfocus x-ray CT for Toyoura sand and Silica sand, respectively. As shown in the figures, we can clearly distinguish each particle from others. It was confirmed that the spatial resolution of this system was very high enough to visualize non-destructively the microstructures in sand specimens with rather larger specimen and that the microstructural changes in sand specimen during triaxial tests could be studied in the future.
Figure 7. Microstructures of sand samples visualized by the microfocus X-ray CT
5. Conclusions
The strain localization behavior in unsaturated Toyoura sand during and after the triaxial compression and Maruyamagawa clay during unconfined compression test was visualized using a microfocus x-ray CT with high spatial resolution. The development of shear bands in the unsaturated sand specimens was clearly observed and the strain localization mode was similar to that of published results for air-dried sands. The microstructures of sands were successfully observed by the partial CT scan, namely, soil particles and pore air can be seen independently. It was confirmed that the spatial resolution and the x-ray energy of the microfocus x-ray CT used in this study is high enough to visualize the strain localization behaviors and microstructures in soil specimens with the usual sizes of triaxial specimens. We will study the microstructure changes in the shear bands of soil specimens through comparison with air-dried or fully saturated soils and qualitative evaluation of local void ratio or local water content by the CT images, in the future.
6. References
Alshibli K.A., Sture S., Costes N.C., Frank M.L., Lankton M.R., Batiste S.N. and Swanson R.A., “Assessment of localized deformations in sand using X-ray computed tomography”, Geotechnical Testing Journal, Vol.23, No.3, 2000, p. 274-299.
Desrues J., Chambon R., Mokni M. and Mazerolle F., “Void ratio evolution inside shear bands in triaxial sand specimens studied by computed tomography”, Géotechnique, Vol.46, No.3, 1996, p. 539-546.
Kikuchi Y., “Investigation of engineering properties of man-made composite geo-materials with micro-focus X-ray CT”, Advances in X-ray Tomography for Geomaterials, Proc. of the Second International Workshop on X-ray CT for Geomaterials, GeoX 2006, Aussois, France, 2006, p. 255-261.
Kodaka T., Oka F., Otani J., Kitahara H. and Ohta H., “Experimental study of compaction bands in diatomaceous mudstone”, Advances in X-ray Tomography for Geomaterials, Proc. of the Second International Workshop on X-ray CT for Geomaterials, GeoX 2006, Aussois, France, 2006, p. 255-261.
Matsushima T., Uesugi K., Nakano T. and Tsuchiyama A., “Visualization of grain motion inside a triaxial specimen by micro X-ray CT at SPring-8”, Advances in X-ray tomography for geomaterials, Proc. of the Second International Workshop on X-ray CT for Geomaterials, GeoX 2006, Aussois, France, 2006, p. 255-261.
Oda M., Takemura T. and Takahashi M., “Microstructure in shear band observed by microfocus X-ray computed tomography”, Géotechnique, Vol.54, No.8, 2004, p. 539-542.
Otani J., Mukunoki T. and Obara Y., “Characterization of failure in sand under triaxial compression using an industrial X-ray CT scanner”, Solis and Foundations, Vol.40, No.2, 2000, p. 111-118.