
Assessment of Time-Space Evolutions of Intertidal Flat Geo-Environments Using an Industrial X-ray CT Scanner
ABSTRACT. An industrial x-ray computed tomography (CT) scanner was used to investigate the time-space evolutions of vertical sediment structures in an intertidal flat with non-destructive conditions, at the mouth of the Shirakawa river, Japan. Seasonal sediment core samples were collected over one year at two locations. One location was Manila clam (Ruditapes philippinarum)-dominant, and the other clam non-dominant. Reconstructed three-dimensional images using Hounsfield Units (HU) demonstrated that water retention volumes in the intertidal sediment in the clam-dominant area existed up to 4 cm below the sediment surface. The CT results revealed that low-bulk density regions below the water-sediment interface are necessary for the survival of the Manila clam. Moreover, the shell hash composition of the substrate appeared to be related to the clam’s distribution.
KEYWORDS: Manila clam, biogenic structure, water retention, shell hash, industrial x-ray CT
1. Introduction
The Manila clam, Ruditapes philippinarum, a macrobenthic bivalve, is an important species for commercial fisheries in many countries. In Ariake Sound, Kyushu, Japan, the fishery yield of Manila clams increased considerably in the 1970s, reaching a peak of 65,000 metric tons in 1977, but decreased rapidly throughout the 1980s (Tamaki et al. 2008). Ecosystem protection and management in intertidal zones requires an understanding of the influence of geo-environmental properties as well as chemical and biological properties.
Geo-environmental properties including porosity, water retention, and sediment density profiles are known to be modified by the burrowing activity of macrobenthic species (Mazik et al., 2008). Sassa and Watabe (2007) demonstrated that suction, negative pore water pressure relative to atmospheric air pressure, also has a substantial influence on the geo-environmental properties of intertidal zones. Moreover, water retention in the sediments and the burrowing activity of macrobenthic animals were found to be closely linked to suction dynamics. The burrowing activity of macrobenthic species involves the construction of tubes, burrows, and galleries in sediment. These are generally called biogenic structures. Biogenic structures play a key role in the functioning of water-sediment interfaces and are important to consider in functional ecology studies (Rosenberg et al., 2007). Despite the recognized importance of biogenic structures, the visualization and quantification of the space occupied by such structures in the sediment remains difficult using current techniques.
Recently, medical x-ray computed tomography (CT) scanning techniques have been used to visualize biogenic structures and sediment density profiles within marine sediment cores in two and three dimensions. (Mermillod-Blondin et al., 2003; Dufour et al., 2005; Rosenberg et al., 2007; Mazik et al. 2008; Bouchet et al., 2009). X-ray CT scanning is one of the best non-destructive techniques for investigating biogenic structures. It has been proposed that this technique could be used in routine environmental analysis (Perez et al. 1999). However, all studies using this technique to date have aimed to visualize and quantify the biogenic structures of macrobenthic animals. No study has directly compared the time-space evolutions of geo-environmental properties, including water retention, at multiple locations within an intertidal flat.
We used an industrial x-ray computed tomography (CT) scanner to investigate the time-space evolutions of water retention volumes of an intertidal flat with non-destructive conditions at the mouth of the Shirakawa River in Kyushu, Japan. We measured the water retention volumes of the intertidal flat to clarify the relationship between Manila clam habitats and seasonal variations in water retention volumes. Sediment core sampling was conducted seasonally over one year, at two places: one area was clam-dominant, the other clam non-dominant.
2. Materials and methods
2.1. Study site
The study site is located at the center of the eastern coast of Ariake Sound in Japan, which is a closed inner bay as depicted in Figure 1(a). The length, width, and depth of the Sound are approximately 97 km, 20 km, and 20 m, respectively. Figure 1(b) depicts the intertidal flat adjacent to Shirakawa River mouth, where we collected core samples. The tide is semidiurnal, and the mean spring tidal range is 3.86 m (Yamada and Kobayashi, 2004). The average wave height and period are 0.2 m and 3 s, respectively. The characteristics of flow velocity, suspended sediment concentration, salinity, and suspended sediment flux at this study site were described in detail in Yamada et al. (2009).
Tamaki et al, (2008) described the Manila clam dominant and non-dominant areas within this intertidal flat, based on field observations. In Figure 1(b), the closed red ellipse shows the Manila clam dominant area located in the low-tide zone, and the closed yellow ellipse shows the non-dominant area, located in the mid-tide zone. Black circles show the core sampling points with the points A and B located offshore, at distances of 1,500 and 1,000 m from the seawall.
Figure 1. Study site in Ariake Sound at the mouth of Shirakawa river in Kyushu Island, Japan
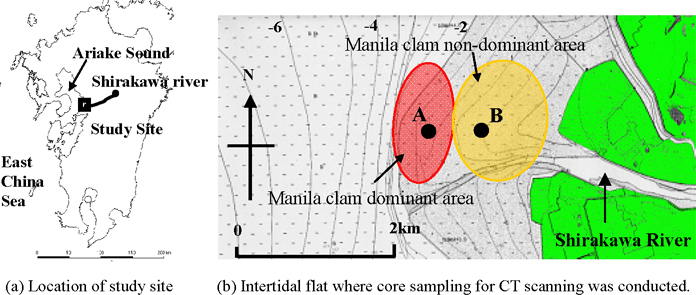
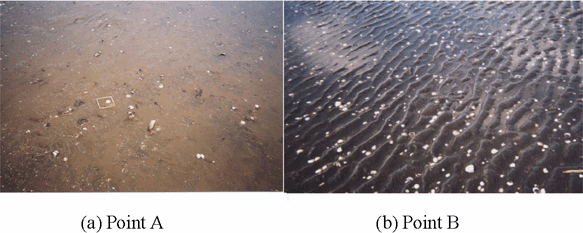
Photo 1 compares the surface topography of both the clam dominant (Point A) and non-dominant (Point B) areas in the intertidal flat during low tide. The sand ripples are more pronounced at Point B, with an average wavelength of 10 cm and wave height of 1 cm. The flat is composed of a mixture of sand and mud. The median diameter at Point A was 0.12 mm, finer than that at Point B. The mud content at Point A was 10 to 20%, higher than that at Point B.
Photo 1. Surface topography of both the Manila clam dominant and non-dominant areas
2.2. Core sampling
Seasonal sediment core sampling at both points during low tide was conducted in 2007 (Table 1). Sediment sampling was carried out with 400 mm-long cylindrical acrylic tube that was 100 mm in diameter and 5 mm in thickness. The corer was pushed vertically into the sediment, ensuring that no twisting occurred, so as to minimize distortion of biogenic structures. The cores were carefully dug out, again aiming to minimize disturbance. The top of each core was sealed with a paraffin plug to preserve the water-sediment interface and biogenic structures during transportation from the field to the laboratory. The cores were scanned within three days following collection.
Table 1. Dates of core sampling
2.3. CT scanning
The x-ray CT scanner uses x-rays to measure the mean absorption coefficient of examined material. The resulting cross-sectional images are displayed in grey-scale; with darker zones representing lower and lighter zones higher x-ray attenuation. X-ray attenuation is defined by the absorption coefficient μ, as expressed in Beer’s law. Grey-scale values in numeric files are expressed as Hounsfield Units (HU), obtained by comparing the absorption coefficient for material μs to that for water μw as follows:
[1] ![]()
Equation [1] demonstrates that the HU of water is zero. The HU of air should be −1,000 because the absorption coefficient for air is zero. Conventional studies have assumed that x-ray attenuation was linearly related to the density of the sample. This is true for biological samples like the human body, but becomes more complex for dense plastic samples (Boespflug et al., 1995). Because medical CT scanners typically use between 40 and 140 kV of power, the two dominant effects characterizing the x-ray interactions with the material are the photo-electron and the Compton effects (Duliu, 1999). Hence, the linear attenuation coefficient depends upon both the effective atomic number Zef and the density ρ of the examined material. Although Duchesne et al. (2009) developed a correction method for the photo-electron effect for x-ray attenuation coefficients, quantitative information on x-ray absorption is sometimes unclear. Therefore, in this study, the HU is considered as a specific unit and its variation interpreted empirically.
Scanning of the sediment cores was performed using an industrial x-ray CT scanner (Toshiba, Toscanner-23200) at Kumamoto University, Japan. The scanning system was described in detail by Otani et al. (2000). Using a source radiation of 300 kV and 2 mA, cross-sections with a thickness of 1 mm were then made from the water-sediment interface to a depth of 80 mm, giving 80 images per core. A CT transverse section is the uniform distance between sequential slices. We obtained two-dimensional (2D) images composed of pixels on a matrix of 2048 × 2048 pixels, and three dimensional (3D) images composed of voxels. The pixel resolution was 0.073 mm × 0.073 mm, and the pixel area was 0.0053 mm2. The voxel volume was 0.0053 mm3.
3. Results
A 2D CT image for each cross-section was obtained based on the HU distributions. Figure 2 shows 2D images of both the clam dominant and non-dominant areas at a depth of 3 cm from the bottom surface on February 4, 2007. Shell hashes were visible in the clam dominant area, as shown in Figure 2 (a). Live adult specimens of the bivalve Mactra veneriformis, were present only in the non-dominant area, as shown in Figure 2 (b). Biogenic structures, such as tubes and burrows are present in both images. In a comparison of the images, the clam dominant area was found to have more low-density regions than the non-dominant area.
The histograms of the HU values of all 80 images of both areas were compared, as shown in Figure 3. Although the average and peak HU at both locations were similar, a marked difference occurred when HU was close to zero. Since the HU of water is zero, the water retention volume of the clam dominant area was larger than that of the clam non-dominant area.
To examine the spatial distribution of water retention volume in the sediment core, 3D reconstructions of CT images were obtained using the HU corresponding to water (Figure 4). The water retention HU range of 0 to 100 was used to estimate the water voxels. As shown in Figures 4(a) and (c), the reconstructed 3D image of the clam dominant area in February 2007 demonstrated water retention in the intertidal sediment up to 4 cm below the sediment surface. Since the shell HU range was found to be over 1,200, 3D shell images were also reconstructed, as shown in Figure 4(b). The CT results suggested that the regions of water retention, as well as the low-bulk density regions below the water-sediment interface, are necessary for the survival of the Manila clam.
Figure 2. 2D images at 3cm depth from the bottom surface on February 4, 2007
Figure 3. Histograms of HU values of whole 80 images on February 4, 2007
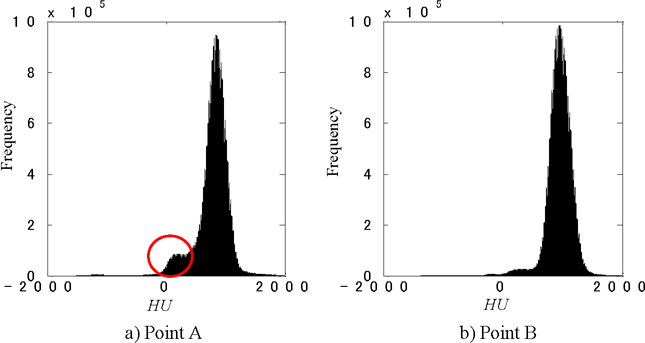
Figure 4. 3D reconstructions of CT images on February 4, 2007
Figure 5. Time-space evolutions of water retention volumes in 2007
4. Discussion
To examine the time-space evolutions of water retention volumes on a seasonal time scale, we compared reconstructed 3D images using whole observation data from one Manila clam dominant and one non-dominant area (Figure 5). The ratio of water HU pixels with a range of 0 to 100 total pixels gave the percentage of water retention volumes in each 2D cross-section. As shown in Figure 5, the water retention regions of the clam dominant area were present in the intertidal sediment up to 4 cm below the sediment surface during the rainy and winter seasons. In summer and autumn, retention of water was almost absent because of high temperatures and sunshine. Sassa and Watabe (2007) proposed that suction dynamics associated with tide-induced ground water level variations have important effects on water retention in intertidal zones. The CT results in the present study lend further support to this notion. Finally, to investigate why water retention was higher in the clam dominant area, after CT scanning each core was sectioned from the top into slices of 50 mm. Each slice was passed through three sieves (mesh size of 4, 8, 16 mm). These results further suggest that shell hash compositions of substrates were related to water retention in the clam dominant area.
5. Conclusions
An industrial x-ray computed tomography (CT) scanner was used to investigate the time-space evolutions of vertical sediment structures in an intertidal flat. Seasonal sediment core samples were collected over one year at two locations, one clam-dominant and one clam non-dominant. 3D images reconstructed using HU showed that water retention volumes in the intertidal sediment at the clam-dominant area existed up to 4cm below the sediment surface. The CT results suggested that low-bulk density regions below the water-sediment interface are necessary for the survival of the Manila clam. Moreover, our results suggest that shell hash compositions of substrates are related to the distribution of the Manila clam. Overall, our study demonstrated that the industrial x-ray CT scanner is a useful tool for analyzing the vertical distributions of water retention in the bottom sediment layers, because the cores can be examined under non-destructive conditions.
6. Acknowledgements
This study was supported by a Grant-in-Aid for Scientific Research by the Japan Society for the Promotion of Science and Fisheries Agency of Japan.
7. References
Boespflug, X., Long, B. F. N., and Occhietti, S., “CAT-scan in marine stratigraphy: a quantitative approach”, Marine Geology, vol. 122, pp. 281-301, 1995.
Duchesne, M. J, Moor, F. Long, B. F., Labrie, J., “A rapid method for converting medical Computed Tomography scanner topogram attenuation scale to Haunsfield unit scale and to obtain relative density values”, Engineering Geology, vol. 103, pp. 100-105, 2009.
Dufour, S. C., Desrosiers. G. Long, B., Lajeunesse, P. Gagnould, M. Labrie, J., Archambault, P., Stora, G., “A new method for three-dimensional visualization and quantification of biogenic structures in aquatic sediments using axial tomodensitometry”, Limnology and Oceanography: Method, vol. 3, pp. 372-380, 2005.
Duliu, O. G., “Computer axial tomography in geosciences: an overview”, Earth-Science Review, vol. 48, pp. 265-281., 1999.
Mazik, K., Curtis, N. Fagen, M. J., Taft, S., Elliot, M., “Accurate quantification of the influence of benthic macro- and meio-fauna on the geometric properties of estuarine muds by micro computer tomography”, J. of Experimental Marine Biology and Ecology, vol. 354, pp. 192-201, 2008.
Mermillod-Blondin, F., Marie, S., Desrosiers, G., Long, B., de Montety, L., Michaud, E., Stora G., “Assessment of the spatial variability of intertidal benthic communities by axial tomodensitometry: importance of fine-scale heterogeneity”, J. of Experimental Marine Biology and Ecology, vol. 287, pp 193-208, 2003.
Otani, J., Mukunoki, T., Obara, Y., “Application of X-ray CT method for characterization of failure soils”, Soils and Foundations, 40, pp. 111-118, 2000.
Perez, K.T, T. P., Earl, W. D., Richard, H.M., Peter, R.B., Michel, S.R., John, A.C., Roxanne, L.J. and Daniel, N. K., “Application of computer-aided tomography (CT) to the study of estuarine benthic communities”, Ecological Applications, 9(3), pp. 1050-1058, 1999.
Rosenberg, R., Davey, E., Gunnarsson, Norling, K., and Frank, M., “Application of computer-aided tomography to visualize and quantify biogenic structures in marine sediment”, Marine Ecology Progress Series, vol. 331, pp. 23-34, 2007.
Sassa, S., Watabe, Y., “Role of suction dynamics in evolution of intertidal sandy flats: Field evidence, experiments, and theoretical model”, J. of Geophysical Research, vol. 112, F01003, doi:10.1029/2006JF000575, 2007.
Tamaki, A., Nakaoka, A., Maekawa H., Yamada, F., “Spatial partitioning between species of the phytoplankton-feeding guild on an estuarine intertidal sandflat and its implication on habitat carrying capacity”, Estuarine, Coastal and Shelf Science, vol. 78, pp. 727-738, 2008.
Yamada, F., Kobayashi, N., “Annual tide level and mudflat profile”, J. of waterway, Port, Coastal and Ocean Engineering, vol.130, pp. 119-126, 2004.
Yamada, F., Kobayashi, N., Sakanishi, Y., Tamaki, A., “Phase averaged suspended sediment fluxes on intertidal mudflat adjacent to river mouth”, J. of Coastal Research, vol. 25, pp. 350-358, 2009.