
Quantitative Description of Grain Contacts in a Locked Sand
ABSTRACT. Quantifying the fabric of intact soil is of great importance in both geomechanics and geology. A unique and interesting example of fabric can be found in “locked sands”. These geologically old sands are characterized by significant grain interlocking and a low cement content. They can be sampled with minimal fabric disturbance. This study analyzes images acquired by x-ray microtomography of resin impregnated samples of a natural sand, Reigate Silver Sand part of the Folkestone Bed formation from southeast England. 2D and 3D image analyses were carried out to identify the grain-grain contacts and quantify individual contact areas. In contrast to earlier studies that have focused on the coordination number, this work demonstrates that for non-punctual contacts a measure of fabric that considers the contact area may be more appropriate.
KEYWORDS: granular material, fabric, contacts, image analysis, locked sands
1. Introduction
This paper considers fabric characterization of a type of natural sand formation referred to as a “locked sand”. The term “locked sand” was introduced by Dusseault and Morgestern (1979) to describe sands that, due to particular deposition conditions, have very low porosity values and a fabric comprising of inter-locked grains. In addition to being a very interesting material to study, the locked fabric of these sands allows undisturbed samples to be obtained. Previous studies on the fabric of natural soils have been limited due to the difficulties in sampling and examining undisturbed samples. A block sampling method was used in this project to obtain intact sand samples. Samples were carefully trimmed in the laboratory and impregnated with a resin prior to extracting sub-volumes for µCT scanning and microscopy. A methodology that makes use of image analysis together with x-ray micro tomography is presented for a three dimensional (3D) characterization of the grain to grain contacts. Combining 2D and 3D characterization will give insight into the applicability of existing two dimensional (2D) to real 3D materials.
2. Locked sand
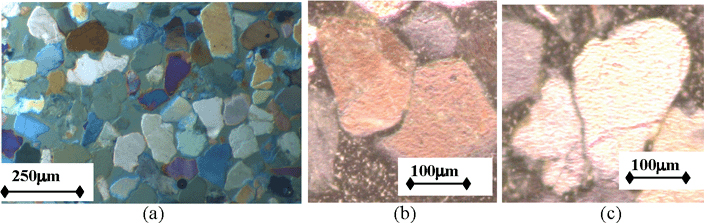
Locked sands constitute an extreme example of fabric, where grains with irregular and complex morphologies are interlocked with other grains as can be seen in Figure 1(a). As a consequence of these arrangements, in their natural state these sands exhibit relative densities greater than 100%, i.e. the in situ porosities are less than can be obtained following the standard ASTM method to obtain the maximum material density. Regarding the type of contacts, there is a predominance of straight contacts and concavo-convex contacts giving high grain-grain contact areas, as shown in Figure 1(b) and (c) respectively. Tangential or point contacts are less frequent and floating particles (i.e. particles with no contacts) are very rare. The fact that this type of fabric cannot be reproduced in laboratory makes it particularly attractive to micro-scale characterization and above all requires intact samples to be used in investigations of the mechanical response. While the original strata to which the term “locked sands” are found in North America (Dusseault and Morgestern, 1979), there are similarities between these formations and the Lower Greensand Formation located in South-Eastern England.
To understand the way the components of fabric influence the yielding and stiffness of these materials, the behavior of intact and reconstituted samples (i.e. samples produced in laboratory following destructuration of the material), of Greensand were compared by Cuccovillo & Coop (1997) and Cresswell & Powrie (2004). The intact sand samples (with undisturbed fabric) were found to have higher shear stiffnesses, higher rates of dilation and higher peak strengths than equivalent reconstituted samples.
Figure 1. Thin sections of Reigate Silver Sand under cross polarized light (a) illustrating the interlocking fabric (b) concavo-convex contact (c) straight contact
3. Material and methods
3.1. Reigate Silver Sand
Reigate Silver Sand is part of the Folkestone Beds – Lower Greensand Formation, a marine shallow-water deposit from Cretaceous Age. It is a quartzitic sand, classified as being fine to medium graded with mean grain diameter of about 270 µm. It is virtually free of cementation with the exception of some localized deposition iron oxide evidenced by staining.
3.2. Field sampling
The intact samples of Reigate Silver sand were sampled at Park Pit Quarry Buckland, Reigate (SE England). The block sampling methodology used consisted of obtaining undisturbed blocks of the material for transportation to the laboratory. The ability of this sand to remain intact in the absence of a confining pressure made it possible to shape blocks of undisturbed soil to a slightly smaller size than the prefabricated wooden boxes (35 × 35 × 25 cm). Each block was then wrapped in clingfilm and waxed to create an effective barrier against moist loss. Once the wooden box was placed around the block, expansive foam was injected between the soil and the box walls to provide a confinement, minimizing the disturbance to the sample during transportation. The foam was left to set, the base of the block was cut with a wire saw and the block was gently turned over prior to being closed.
3.3. X-ray micro CT imaging
The degree of resolution required to analyze the grains in detail necessitated the use of small CT samples only a few millimeters diameter. As a consequence of the friable character of this sand, obtaining this size of sample without significant fabric disruption required the sand to be impregnated with resin.
Cylindrical samples, 38mm in diameter and 76mm high were impregnated in a modified triaxial cell. During impregnation, a constant rate of resin flow was maintained while keeping the flow rate low enough to minimize the disturbance of the soil fabric and to prevent air bubbles from being trapped in the soil pores.
Epo-Tek 301, a very low viscosity resin was used. The CT samples were then drilled from these impregnated triaxial samples, to sizes of about 4 mm to 6 mm, mounted on a rotating steel sample holder and imaged using the commercial microCT systems. A 3D grayscale volume was reconstructed from the series of 2D projections. The final volume was a binary 16 bit dataset. Different magnifications were used resulting in resolutions ranging from 0.8 µm to 7.0 µm. It was found that for this material and for the purpose of the analysis, resolutions of around 3µm give good results. The wide range of particle sizes and the complex morphology of the grains were found to be the primary factors controlling the resolution for this analysis. In fact for resolutions of 7µm details are lost and the grains become blurred. This happens because properties of different materials are merged within a single voxel, i.e. the grain-void transitions are defined by voxels with intermediate gray values. Therefore grain edges are not clearly defined and this inhibits contact detection.
4. Image analysis
Image analysis involves the extraction of measurements from an image. Prior to analysis, µCT images are converted from grayscale to images with meaningful structures. Image processing algorithms were used in order to obtain segmented images where the pixels belonging to each grain are assigned grey level that clearly differentiates them from both the void space and the other grains. The segmentation technique used is based on the 3D watershed algorithm and further details can be found in Fonseca et al. (2009).
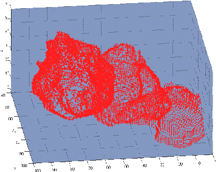
Figure 2 shows the result of morphological segmentation on a 3D image developed from an original dataset with 2.5 µm resolution. These images are then converted into MATLAB matrices, with 2D arrays representing 2D images and 3D arrays representing 3D images. Each pixel in the image corresponds to a single element in the matrix and the value of this element is the pixel intensity or grey level. Figure 3 is a magnified sub-volume of Figure 2, displaying the individual pixels forming the grain surfaces.
Figure 2. Representative image processing output, 3D
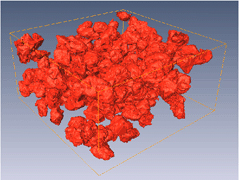
Figure 3. Image analysis input, 3D
A MATLAB code based on the image processing toolbox (Mathworks, 2004) was developed to identify the contacts between two grains and measure the contact areas as well as the particle surface areas (in both cases these are lengths in 2D). In the algorithm used the elements in the matrices representing the images are assigned a value 0 if they correspond to the background (or pore space) pixels. The pixels representing the solid particle volume are given integer values ranging from 1 to Np, where Np represents the number of particles. The contacts between particles are then identified in an automated process of finding for each pixel the neighboring pixels meet the criteria of having an intensity value that is both different from the primary pixel and is not 0. The contact pixels are labeled with a distinct grey value (that is greater than Np) and the contact related information is stored using the cell array data structure available within MATLAB.
4.1. Grain contact description
Prior grain contact characterization of locked sands has been mainly 2D and qualitative using descriptions like tangential, long or short straight and long or short concavo-convex, (e.g. Palmer and Barton, 1987). Some indices have been proposed to quantitatively characterize the degree of interlocking on a locked sand including the Tangential Index (TI) that gives the proportion of tangential (or point) contacts amongst all grain-grain contacts (Barton, 1993). In general, the most basic particle scale metric to characterize the packing granular media is the coordination number (CN). The average coordination number is defined as the average number of contacts per particle in the system, i.e. twice the number of contacts divided by the number of particles. The coordination number for an individual particle is simply the number of contacts in the system that involves that particle. An additional particle scale measure of contact intensity, the average Contact Index (CI) is introduced here. The CI for an individual particle is the ratio between the contact surface area (SC) and the particle surface areas (SP). The average CI for the system is given by equation [1]. In 2D Sc is calculated as a contact length while Sp is the particle perimeter.
[1] ![]()
5. Results and discussion
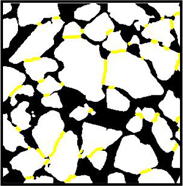
The results of the grain contact investigation for two images, one 2D and the second 3D, are presented here. Figure 4 shows the 2D segmented image with the particles displayed in different colors, while Figure 5 shows the contacts between particles. The focus of the research to date has been an assessment of the sensitivity of the microCT data to the imaging approach adopted, as well as the development of the segmentation algorithms (Fonseca et al., 2009). The analysis of the system is computationally expensive and requires significant computer memory. The data presented here are therefore the preliminary results following development of the necessary image processing and analysis algorithms and only a limited volume is considered. Despite the small dataset considered useful insight into the material fabric is attained.
Figure 4. Image after segmentation, 2D
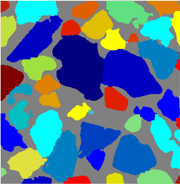
Figure 5. Contacts identification, 2D
The particle coordination numbers are presented in Figure 6(a) and (b) for the two and three dimensional analyses respectively. The range of coordination number values observed in the 3D case (1-10) greatly exceeds the 2D range (1-4). The average CN values were 2.16 in 2D and 3.67 in 3D. The range of coordination numbers will always be greater in 3D in comparison with the 2D case; uniform 2D disks can attain a maximum coordination number of 6, while uniform 3D spheres can attain a value of 12. In this case the 2D image considers only contacts intercepted by an (arbitrary) planar surface. In contrast, the 3D data takes the entire particle volume into account and all the contacts are counted, not just those intercepted by the section plane. While there are no particles with a CN value of 0 (in these images), in both analyses there are noticeable number of particles with CN=1. For the 3D data, particles with a CN of 1 cannot participate in stress transmission through the material. Particles with a high CN values are less frequent than particles with low CN values. This is a consequence of the range of particle sizes, there are fewer larger particles and the CN values tend to increase with increasing particle size.
Figure 6. Histograms of particle coordination numbers (CN) (a) 2D (b) 3D
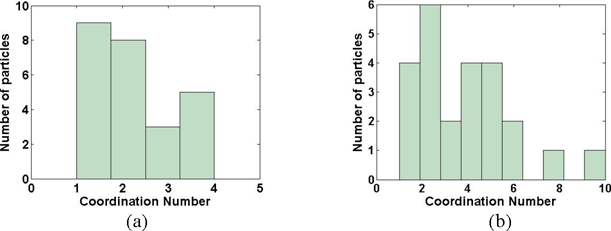
Figure 7. Histograms of particle contact indices (CI) (a) 2D (b) 3D
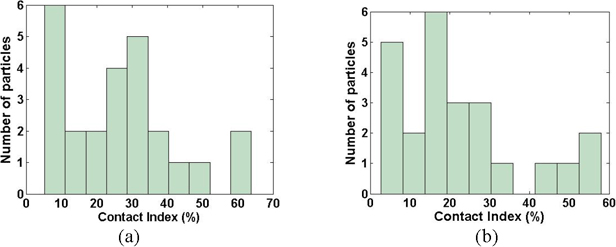
Figure 8. Contact index (CI) variation with Coordination Number (CN) (a) 2D (b) 3D
The contact index data is presented in Figure 7(a) (2D) and Figure 7(a) (3D). The data is rather erratic and it is difficult to identify a dominant or representative CI value, it is however clear from both the 2D and 3D analysis that most of the particles have CI values in that are less than 30%. However, in 3D the CI value can exceed 50%. The average CI values were 27% in 2D and 22% in 3D. One would expect a linear relationship between the CI and CN values, i.e. the proportion of the particle surface participating in a contact should increase as the number of contacts increases. The CI values for each particle are plotted against the corresponding CN values in Figure 8. There is indeed a general trend for the CI values to increase as the CN numbers increase; however there is a very large amount of scatter. Upon fitting a straight line to the data using a least squares approach, the correlation coefficient for the 2D data was only 0.39 and the 3D data showed an even poorer fit, with a correlation coefficient of only 0.27. It is particularly interesting to consider the 3D data. From this data it is seen that particles with the highest CN values have relatively low CI values, this is a consequence of the presence of tangential contacts increasing the CN to particularly high values. There is also a particle size effect. A large grain may be surrounded by smaller grains and in this case, the CN value is high because of the number contacts, but the CI can be low as the contact area in each case will be small relative to the size of the large grain. On the other hand, a small grain can potentially participate in a relatively large conforming contact. Consequently, in 2D CI values of 40% are observed in cases where the CN is 1. It seems that such large CI values are not attainable for the low CN values in 3D, however it is notable that the highest CI values observed in 3D correspond with CN values that were just slightly higher than the average CN value of 3.67.
6. Conclusions
This paper has presented a methodology to characterize the fabric of natural locked sands based on the qualitative description of particle contacts. Using µCT images of intact soil, an algorithm was developed to identify and measure the contacts. Rather than classifying the contact intensity simply by using the coordination number (whose use is very common in discrete element analyses), the contact index parameter that considers the contact area was introduced. While the contact index tended to increase with coordination number, the two parameters are poorly correlated. The energy required to cause slip along the contacts (and hence deformation of the material) will be related to the contact area, rather than simply the coordination number. Use of the contact index parameter is particularly important for materials with non-punctual contacts. Furthermore the 3D analysis has also revealed information that cannot be obtained by looking at 2D sections.
7. References
Barton, M.E., “Cohesive sands: The natural transition from sands to sandstones”, Geotechnical Engineering of hard Soils-Soft Rocks, Balkema, Rotterdam, 1993.
Cresswell, A., Powrie, W., “Triaxial tests on an unbonded locked sand”, vol. 54, no. 2, pp.107-115, Géotechnique, 2004.
Cuccovillo, T., Coop, M.R., “Yielding and pre-failure deformation of structured sands”, vol. 47, no. 3, pp.491-508, Géotechnique, 1997.
Dusseault, M.B., Morgensten, N.R., “Locked sands”, vol. 12, pp. 117-131, Q. J. Engng. Geol. 1979.
Fonseca, J., O’Sullivan, C., Coop, M.R., “Image Segmentation Techniques for Granular Materials” Powders and Grains, Nakagawa and Luding (eds.), Melville, New York, 2009.
Mathworks, Image Processing Toolbox 7.0 (2004).
Palmer, S.M., Barton, M.E., “Porosity reduction, microfabric and lithification in UK uncemented sands”, no. 36, pp. 29-40, Geological Society Special Publication, 1987.