
Quantification of Physical Properties of the Transitional Phenomena in Rock from X-ray CT Image Data
ABSTRACT. X-ray CT method is generally used for the visualization of the geometry, the identification of defects and cracks, and the observation of transitional phenomena, such as water permeation and material migration process, in geo-materials. In this paper, examples of quantification of physical properties by CT values were introduced. The first is the analysis of the advection and diffusion process in the fractured porous rock sample. The tracer migration tests have been applied to the porous sandstone and the density distribution of the in the crack and the pores were evaluated. The second is the evaluation of the storage ability of CO2 in the porous rock related to the geological storage of CO2. The replacement ratio in the pores by CO2 was estimated.
KEYWORDS: quantification, CT values, advection and diffusion, geological storage of CO2
1. Introduction
X-ray CT method is well known as one of the most useful visualization techniques not only the in medical use but also in the field of Geo-materials engineering (Otani et al., 2003, Desrues et al. 2007). Generally, x-ray CT method is used for the visualization of the geometry, the identification of defects and cracks, and the observation of transitional phenomena, such as water permeation and material migration process (Sato et al. 2009), in rock sample. The information obtained from the x-ray CT images is based on the density information, and it is convertible into to the various kinds of physical quantities. In this paper, we would like to introduce two examples of quantification of physical properties.
The first is the analysis of the advection and diffusion process in the fractured porous rock sample (Yonemura et al. 2008). The tracer migration tests have been applied to the porous sandstone and the tracer migration and diffusion process was visualized by x-ray CT scanner. Then the density distribution of the tracer in the cracks and pores are quantified from x-ray CT data.
The second is the evaluation of the storage ability of CO2 in the porous rock related to the geological storage of CO2 (Chadwick et al. 1993, Xue Z et al. 2004). When the CO2 is injected into a water saturated rock sample, the nominal density changes since the water in the pore is replaced by low density CO2 (Arimizu et al. 2008). This phenomenon is measured by x-ray CT, and the amount of the CO2 stored in the sample is quantified.
Here the quantification process of those phenomena from x-ray CT data is introduced, and the applicability of the x-ray CT method not only as the visualization method but also as the measurement and quantification techniques is discussed.
2. Employed x-ray CT scanner
An x-ray CT scanner (TOSCANER-20000RE), manufactured by the Toshiba Corporation, has been operated by Kumamoto University. An x-ray bulb operating at 300 kV/2 mA provides the radiation source from which an x-ray beam is emitted. 176 detectors are aligned with the x-ray source in the horizontal plane to record attenuation data. The object to be scanned is positioned on a traversing turntable and the x-ray beam is projected through one plane of the object as it rotates and traverses. The beam thickness can be determined with collimators and the thickness is set to be 2 mm in this study. The pixel is a square of 0.072 mm × 0.072 mm, and the volume of a voxel is 0.0104 mm3. Please refer to the references for a more detailed description of the specifications and principles (Sato et al., 2009).
3. Analysis of tracer advection and diffusion process in porous rock
3.1. Rock sample and tracer migration test
A 100 mm × 100 mm × 100 mm cubic Kimachi sandstone sample shown in Figure 1 is used for the tracer test. The mean porosity of the sample is 26%. At first, the artificial crack was induced by shear test at the center of the sample.
Initially the rock sample was fully saturated by the water. Therefore, both the inside of crack and pores are completely filled with water. The initial x-ray CT image is shown in Figure 2(a). Then the tracer is injected into the rock sample from the bottom surface of the sample under the constant flow rate condition, and the injected tracer migrates upward in the crack. In this study, the mixture of Potassium Iodide (KI) solution and a medical contrast agent is applied, and its density is 1,254 kg/m3.
The x-ray CT images during tracer migration test are shown in Figure 2 (b). As Figure 2 shows, x-ray CT images contain the influence of the heterogeneity of the rock sample and a various kinds of noise components unavoidable in CT images. The image subtraction between CT images is effective for elimination of those noise components (Sato et al. 2004). The image subtraction between initial CT image and the images after commencement of tracer tests are applied, and obtained subtracted images are shown in Figure 3.
Figure 1. Kimachi sandstone rock sample which has shear crack at the center
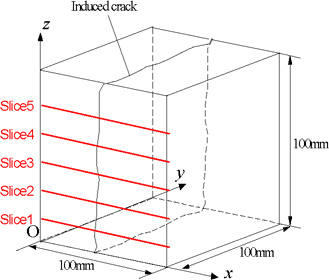
Figure 2. X-ray CT images after commencement of tracer test
Figure 3. X-ray CT images after image subtraction
3.2. Coefficient of tracer density increment α
In order to evaluate the tracer density distribution from the CT images after image subtraction, the coefficient of tracer density increment is defined by Sato et al. 2009. In this study, this idea is expanded to the evaluation of tracer density both in the crack and pores. The CT value increment during tracer test from the initial condition is denoted by ΔCl, and the CT value increment between water and air is denoted by ΔCwater. Firstly, let us focus on the CT value projection in the crack part. When the crack aperture is denoted by w, the projection p is given by
[1] ![]()
where α is a constant of proportion between CT value increments obtained by different conditions, and this is defined as the coefficient of tracer density increment. If we focus on the CT value projection in the rock matrix part including pores, the projection p is also given by
[2] ![]()
From the projection in the both crack part and rock matrix part, the coefficient of tracer density increment in both cases are given in the same form as
[3] ![]()
3.3. Analysis of density distribution of tracer
The distribution of coefficient α along the crack is shown in Figure 4. This represents the density distribution of the tracer which flows in the crack. For the comparison, original x-ray CT image and the crack aperture distribution are also shown in Figure 4(a) and (b), respectively. As this figure shows, the value of α is increasing with time as the water in the crack is replaced by the high density tracer.
Figure 4. Distribution of the coefficient of tracer density increment in the crack
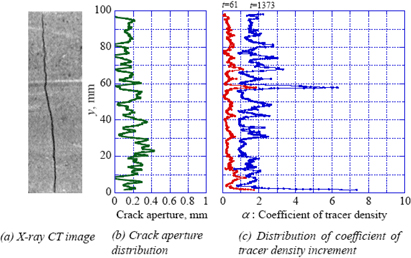
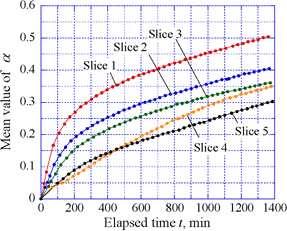
However, this distribution is not uniform. There is a tendency that the value of α become larger at where the crack aperture is small. This is because that water in the small space is easily replaced by the tracer. The distribution of coefficient α in the rock matrix part is shown in Figure 5. This distribution represents mean value of α each tomography region and the amount of tracer diffused into the rock. In this case also, the value of α is increasing with time. This is because the high density tracer in the crack diffused into the pores in the matrix part.
As these figures show, tracer density distribution both in the crack and the in the rock matrix part and the diffusion phenomena can be quantified by introduced x-ray CT image analysis.
Figure 5. Relation between the elapsed time and the mean value of α in the rock matrix part
4. Analysis of CO2 replacement ratio in porous rock
4.1. Rock sample and CO2 replacement test
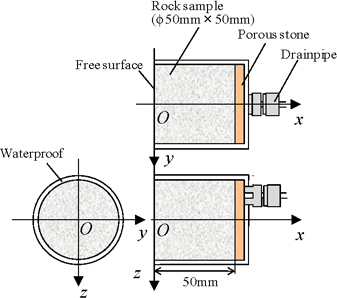
A ϕ50mm × 50mm cylindrical Berea sandstone sample shown in Figure 6 is used for the CO2 replacement test. The side of the sample is completely sealed by acrylic resin. The drain pipe is installed on one end of the sample. Another end is free and the CO2 is injected from this free surface into rock sample. The mean porosity of the sample is 24%. Initially the rock sample was fully saturated by the water. This rock sample is installed in the pressure vessels made by carbon fiber. The initial x-ray CT image is shown in Figure 7(a). X-ray CT images are taken every after 1ml liquid CO2 (8MPa at 25°C) is injected into the rock sample, and replacement process in the water saturated pores by CO2 is visualized by x-ray CT scanner.
Figure 6. Rock sample for CO2 injection tests
4.2. Results
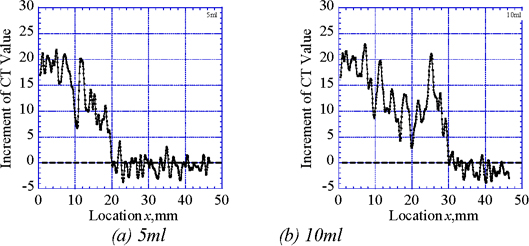
The x-ray CT images during CO2 replacement test are shown in Figure 7(b) and (c). However, it is hardly possible to identify the replacement process of CO2 since the density change due to the replacement of water by liquid CO2 is relatively small. Here also the image subtraction technique is applied between the initial image and the images during CO2 injection test. Obtained images are shown in Figure 8 and the increment CT values are slightly confirmed. In order to clarify the CT value change, distribution of mean CT value increment along x-axis are shown as Figure 9. As this figure shows, CT value change due to the replacement by CO2 is clearly confirmed.
Figure 7. X-ray CT images of Berea sandstone after CO2 injection
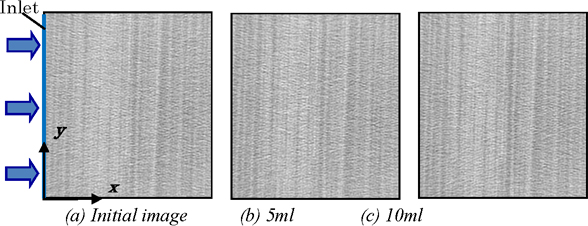
Figure 8. X-ray CT images after the image subtraction by initial image
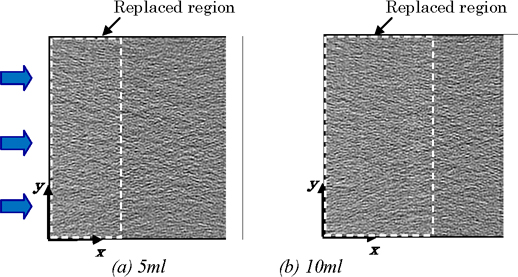
Figure 9. Mean increment of CT values in the x-axis direction
4.3. Replacement ratio Rv
CT values in this study means the value which density difference between the water and the air is divided by 1,000. Therefore, nominal density change due to the CO2 replacement Δρ is given by
[4] ![]()
where ΔCt is the increment of CT values obtained by image subtraction. Here, let us consider the specific volume ΔV of replaced CO2 towards the total volume. When the density of the water and the CO2 are denoted by ρw and ρCO2 respectively, the specific volume ΔV is given by
[5] ![]()
On the other hand, the maximum replaced volume by CO2 is equal to the porosity ϕ. Here replacement ratio RV is defined as the ratio of the replaced volume by CO2 towards the total porosity, and given by
[6] ![]()
4.4. Analysis of replacement process of CO2
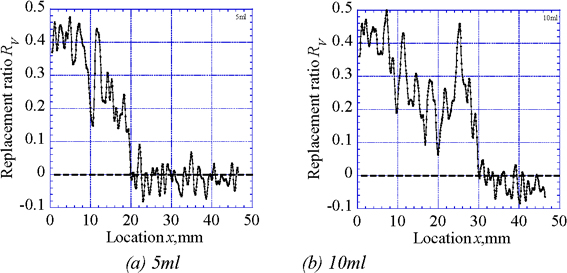
The distribution of replacement ratio RV is shown in Figure 10. As this figure show, the replaced region progresses gradually to the x-axis direction. In the case of Berea sandstone, the maximum replacement ratio is approximately 40%, that is, the 40% of pores are replaced by CO2 and water still exist at 60% of pores. It is also confirmed that the replacement process is not uniform. In this study, CO2 is injected perpendicular to the sedimentary layer. This is confirmed form Figure 6, and the value of RV depends on each layer. The mean value of RV of the rock sample is estimated as 30% approximately at the final stage of injection. This value is almost same as the estimation of RITE (RITE 2005). After that, the replacement was not occurred and the CO2 simply flows through the rock sample.
Figure 10. Mean replacement ratio RV in the x-axis direction
5. Conclusions
X-ray CT images is based on the density information, and it is convertible into to the various kinds of physical quantities. In this study, two examples of quantification of physical properties was introduced. The first is the analysis of the advection and diffusion process in the fractured porous rock sample. The tracer migration tests have been applied to the porous sandstone, it was shown that the density distribution of the in the crack and the pores can be quantified from the x-ray CT image data. The second is the evaluation of the storage ability of CO2 in the porous rock. Even though the density change is very small, it was shown that the quantification of the replacement ratio of CO2 was possible from x-ray CT image data.
6. References
Arimizu T., Sato A., Tanaka K., Yonemura H., “Evaluation of replacement ratio and residual saturation in the water-air replacement process by means of X-ray CT”, Proc.12th Japan symposium on Rock Mechanics: JSRM2008, 2008, CD-ROM.
Chadwick R.A., Eiken O. and Lindeberg E., “4D geophysical monitoring of the CO2 plume at Sleipner, North Sea: Aspects of uncertainty”, Proc. Of the 7th SEGJ Int. Symp., Sendai, 1993, p.24-26.
Desrues J., Viggiani G. and Besuelle, Advances in X-ray Tomography for Geomaterials, 2007.
Otani J., Obara Y., X-ray CT for Geomaterials, -Soilds, Concrete, Rocks, 2003.
Sato A., Arimizu T., Yonemura H. and Sawada A, “Visualization and analysis of the tracer migration process in the crack by means of X-ray CT”, Journal of MMIJ, Vol.125, 2009, p.146-155.
Sato A., Fukahori D., Sawada A. and Sugawara K., “Evaluation of Crack opening in the heterogeneous materials by X-ray CT”, Shigen-toSozai, Vol.120, 2004, p.365-371.
The Research Institute of Innovative Technology for the Earth (RITE), Report of research and development of underground storage technology for carbon dioxide (2005), 2005, p.1104-1525.
Yonemura T., Sato A., “Visualization of advection-diffusion phenomena in the crack and the matrix inside by means of X-ray CT”, Proc.12th Japan symposium on Rock Mechancs: JSRM2008, 2008, CD-ROM.
Xue Z., Ohsumi T, “Seismic wave monitoring of CO2 migration in water-saturated porous sandstone”, Exploration Geophysics, Vol.35, 2004, p.25-32.