
Evaluation of Pressure-dependent Permeability in Rock by Means of the Tracer-aided X-ray CT
ABSTRACT. X-ray Computed Tomography is successfully applied to the visualization of water flow in rock, and to the quantitative determination of the intrinsic permeability under various effective confining pressures. In a specific pressure vessel, one-dimensional water permeation test is performed. The transport diffusion phenomena of tracer is visualized and analyzed so as to evaluate the mean pore velocity of water in rock under the saturated condition, by utilizing the subtraction of CT images along with the data stacking technique. The intrinsic permeability is determined, based upon the Darcy’s law. Case example clarify that the tracer-aided x-ray CT is a promising tool available for the evaluating the intrinsic permeability influenced by the effective confining pressure.
KEYWORDS: rock, visualization, permeability, effective confining pressure, tracer, x-ray CT
1. Introduction
Knowledge of water flow in rock is important for the design and construction of radioactive waste disposal, since the mass transfer phenomenon of radioactive nuclear matter is deeply associated with water current in rock strata, which is expected to play an important role as a natural barrier. Rock that is deep underground is subjected to high confining pressure. Thus, it is necessary to accurately evaluate the influence of the confining pressure on the intrinsic permeability of rock.
The tracer-aided water permeation test system (Fukahori et al. (2006)) is applied for the visualization of one-dimensional horizontal water flow in porous rock, and for the evaluation of the mean pore velocity of water in rock. In this article, the system is briefly described, along with the preparation of high density tracer. Subsequently the image subtraction is proposed for the evaluation of the porosity, along with the image reconstruction of the tracer density, with case examples. Finally the intrinsic permeability is presented and discussed, using the mean pore velocity accurately evaluated from the movement of tracer. Case study makes clear that the present method is a promising tool available for the evaluating the intrinsic permeability influenced by the effective confining pressure.
2. The tracer-aided water permeation test system
2.1. Principal apparatuses
The x-ray CT scanner (TOSCANER-20000RE) in Figure 1 is employed for the present test, in the standard configuration of a beam thickness of 2 mm and an image reconstruction of 2048 pixels × 2048 pixels with a pixel size of 73 µm, under an x-ray bulb operation of 300 kV / 2 mA.
Figure 1. X-ray CT scanner
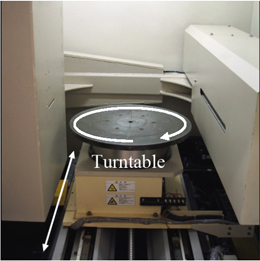
Figure 2. Pressurization system
The water permeation test is conducted with a cylindrical pressure vessel in Figure 2, under a multi-stage pressurization. The vessel is made from acrylic resin, so as to avoid an attenuation of x-rays. The maximum capacity is 20 MPa, and the inner diameter is 10 cm. A specimen is horizontally placed in the center of the vessel, and the horizontal water flow in the specimen is continuously monitored by the scanner. As shown in Figure 2, at the right-hand end of the specimen, an exhaust pipe is installed to discharge the air involved within a porous specimen.
2.2. Preparation of high density tracer of equivalent with water in viscosity
In order to make no disturbance to the water flow in the specimen, a high density tracer having the same viscosity as water is prepared by mixing the potassium iodide and the urografin used for the human body. As shown in Figure 3, the viscosity of tracer (µ) under a constant temperature is independent of the tracer density (ρ), and equivalent to the viscosity of pure water in a range of 0 < ρ < 400 kg/m3.
Figure 3. Viscosity of tracer
Figure 4. Side view of specimen
2.3. Rock specimen and procedure of the tracer-aided water permeation test
Kimachi sandstone of 20% porosity was tested. To create a horizontal water flow in the specimen, as shown in Figure 4, it is fully sealed by resin, excepting the inlet. As previously mentioned, the exhaust pipe has been installed at the outlet with a porous stone, and fully sealed by resin. When the specimen is pressurized in the vessel, water permeates into the specimen from the unsealed end and the pressure at the inlet is equivalent to pressure in the vessel (po), the pressure at the outlet is equivalent to the atmospheric pressure (patm = 0). Therefore, the effective confining pressure at the inlet is σ= 0, the effective confining pressure at the outlet is σ= po.
The present tracer-aided water permeation test consists of an initial water injection into a dry specimen, a series of tracer test. Figure 5 shows a schematic pressure-time diagram of the tracer-aided water permeation test.
The test is commenced from taking an image of dry specimen (CTd). The initial water injection is performed to replace the air in the specimen with water. The higher pressure results in a higher degree of water saturation. This can provide the image of fully-saturation (CTS) just before the tracer test. The tracer test is performed by controlling the inlet pressure (po). Each tracer test is a set of tracer injections over a relatively short time, a subsequent injection of water to transport the tracer into the direction of flow, and finally injection of water under a pressure of 10 MPa so as to remove the tracer and replace with pure water. They can provide the images of tracer migration before the water injection (CTT), and the images of tracer migration during the water injection (CTW).
Figure 5. Schematic pressure-time record of the test: (a) tracer-aided water permeation test; (b) tracer test in case of the inlet pressure po= 6 MPa
2.4. Image processing
The image of porosity is obtained from the images subtraction of CTS – CTd, and the images of tracer migration at certain step by the images subtraction of CTT – CTS, and by CTW – CTS.
3. Theoretical consideration
In general, the intrinsic permeability of rock is determined from the linear form of Darcy’s law. In addition, the intrinsic permeability decreases with increasing the effective confining pressure. In this study, the intrinsic permeability k is given by the following equation (Sugawara et al. (2004)):
[1] ![]()
where m is a rock constant, km is the measurement value given by Darcy’s law as follows:
[2] ![]()
where u is the mean pore velocity of water, μ is the viscosity of water, ϕ is the porosity of rock, and L is the length of specimen.
Moreover, the rock constant m is obtained by the relation between the measurement value km and the effective confining pressure σ. The relation between km and σ so as to estimate the rock constant m is approximated by the following equation (Sugawara et al. (2004)):
[3] ![]()
where kmo represents the intrinsic permeability at σ= σo.
4. Analysis of water flow upon the image processing
4.1. Precise evaluation of the porosity
Figure 6 shows the image of the porosity (ϕ) obtained by the CT image subtraction after the local averaging of 51 pixels × 51 pixels. It can be noted from Figure 6 that the continuous plane of high porosity is parallel to the x-axis direction. It is considered that the continuous plan is the bedding plane, and peculiar to Kimachi-sandstone. The image of the porosity is indispensable for understanding the water flow in rock.
4.2. Non-uniform movement of tracer with water flow
Figure 7 shows the image of the tracer density (ρ) obtained by the CT images subtraction after the local averaging of 51 pixels × 51 pixels. The increase of the tracer density is represented with white. Then the images describe that the tracer injected from the left hand moves to the right hand in this figure, with water flow. It is noteworthy that the front of the tracer is uneven, and the degree of fluctuation increases with time. The width of the visual tracer zone increases with time, while the maximum density is decreasing. This is deeply related to the heterogenous structure of rock, and the diffusion-dispersion mechanism of tracer. In particular, it can be noted that the movement of tracer near the high porosity region A is small. It is considered that the water flow in rock is dependent not only upon the influence of the porosity but also the pore size distribution.
Figure 6. Image of porosity
Figure 7. Images of tracer density
4.3. Evaluation of the mean pore velocity of water in rock
The distributions of the tracer density along the x-axis are summarized in Figure 8, which are obtained from the CT images subtraction and stacking procedure (Sugawara et al. (2004)). They are used to evaluate the mean pore velocity of water (u). The tracer density-distance curve in Figure 8 has a peak as represented with black circles. The mean pore velocity of u is evaluated from the relation between the distance from the inlet to the point of peak and the elapsed time. The value of u is evaluated as shown in Figure 9.
Figure 8. Profiles of tracer density
Figure 9. Mean pore velocity obtained
5. Estimation of the permeability of rock
The intrinsic permeability k evaluated by equation [1] is shown in Figure 10 by black circles. White circles in this figure represent the value of km upon the Darcy’s law. The value of m was obtained by the relation between the km and the effective confining pressure σ. In this figure, results of transient pulse method obtained by using same rock sample are also plotted together. As this figure shows, the computation values in this study are consistent with the results of transient pulse method and it is shown that the intrinsic permeability k decrease with increasing the effective confining pressure.
Figure 10. Evaluation of the intrinsic permeability
6. Conclusions
The practice of the tracer-aided water permeation test of rock is presented to make clear that tracer-aided x-ray CT is a promising scheme available for minute evaluation of pore velocity in rock and the intrinsic permeability of rock. The results obtained show that despite its simplicity, this suggested method, by using the mean pore velocity and the value of m, gives relatively accurate results.
7. References
Fukahori, D., Saito, Y., Morinaga, D., Ogata, M., Sugawara, K., “Study on water flow in rock by means of the tracer-aided x-rays CT”, Advances in X-ray Tomography for Geomaterials, 2006, p.287-292.
Sugawara, K., Fukahori, D., Iwatani, T. and Kubota, S., “Analysis of wetting process of rock by means of X-ray CT”, X-ray CT for Geomaterials –Soils, Concrete, Rocks –, 2004, p.315-334.