
Evaluating the Influence of Wall-Roughness on Fracture Transmissivity with CT Scanning and Flow Simulations
ABSTRACT. Combining CT imaging of geomaterials with computational fluid dynamics provides substantial benefits to researchers. With simulations, geometric parameters can be varied in systematic ways that are not possible in the lab. This paper details the conversion of micro-CT images of a physical fracture in Berea sandstone to several tractable finite volume meshes. By computationally varying the level of detail captured from the scans we produced several realistic fracture geometries with different degrees of wall-roughness and various geometric properties. Simulations were performed and it was noted that increasing roughness increased the resistance to fluid flow. Also, as the distance between walls was increased, the mean aperture approached the effective aperture.
KEYWORDS: fracture flow, finite volume CFD, Navier-Stokes, permeability
1. Introduction
Fractures often provide primary flow pathways within low-permeability geological media. For decades researchers have examined the effects of fracture wall-roughness on fluid transport by separating fractures, measuring the fracture surfaces with a profilometer, reconstructing analogue geometric models, and performing simulations and experiments within the reconstructed geometries (e.g. Brown, 1989; National Research Council, 1996; Konzuk and Kueper, 2004). Micro-CT scanning of rough-walled fractures has been shown to be an accurate method by which fracture geometries can be acquired without using destructive techniques (Karpyn et al., 2007). Computational fluid dynamics (CFD) have been used to model fluid transport in rough-walled fracture geometries (e.g. Eker and Akin, 2006; Hughes and Blunt, 2001; Crandall et al., 2009), but there is scant literature on methods to convert CT images into tractable CFD meshes. Likewise there are few studies that attempt to determine relationships between fracture geometric properties and fracture transmissivity. In this paper both topics are discussed.
The original fracture used to generate the computational domains for this study was created experimentally by Karpyn et al. (2007) within a 101.4 mm long, 25.4 mm diameter core of Berea sandstone. Prior to fracturing, the core had 18% porosity and a permeability of 200 mD. Micro-CT scanning was performed on the fractured sample with a voxel resolution of 27.3 µm × 27.3 µm × 32.5 µm, where 32.5 µm is the slice thickness measured along the length of the rock core. A total of 3116 slices were obtained along the core length. Image processing was conducted to isolate the fracture and identify the inner structure of the crack. Examination of CT registrations allowed the identification of voxels that were characteristic of the fracture void structure and voxels of surrounding rock were removed. This method extracts an approximation of the void structure due to partial volume effects. The differences in reconstructed void space, and its effect on fluid flow, is the main driver behind this investigation. This fracture data set was converted to a smaller data set, with 767 slices along the length and a voxel resolution of 109 µm × 109 µm × 132 µm, to reduce computational memory requirements when converting the data set to CFD tractable geometries.
2. Conversion of CT data to CFD models
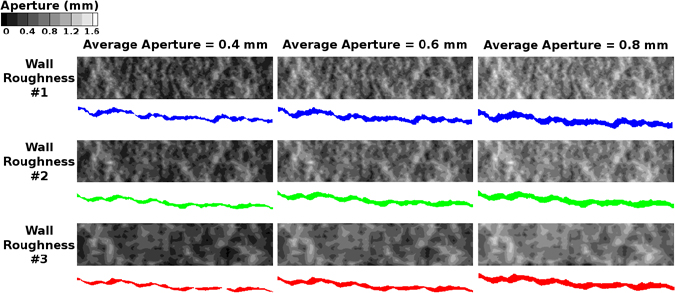
The micro-CT scanned fracture was converted into several three-dimensional (3D) meshes using three software packages; Amira™ (Visage Imaging Inc.), GAMBIT® (Ansys Inc.), and TGrid™ (Ansys Inc.). The resulting meshes were used in the finite-volume CFD solver, FLUENT® (Ansys Inc.) to obtain the flow solutions. Three different fracture roughnesses were obtained by varying the amount of detail retained from the scanned data. The rough fracture walls were separated so that the mean fracture aperture (bavg) was 1, 0.8, 0.6, 0.5, and 0.4 mm. Nine fracture meshes are shown in Figure 1 with two-dimensional (2D) profiles along the fracture lengths. Grayscale aperture plots are shown to illustrate the aperture variability within the geometries, and that the overall aperture distribution is maintained between the different models. In addition, 2D profiles along the fracture lengths and through the center of the width are shown, with the height increased three-fold to illustrate the fracture-wall roughness.
Figure 1. Nine representative rough fracture meshes with 2D profiles
The CT data set was initially constructed into a workable 3D volume by importing the data set into the visualization software Amira and exporting the ASCII geometry. A minor amount of data manipulation was performed in this step to remove isolated voxels and ensure connectivity of the bulk fracture void space. This ASCII file was read into the pre-processing software TGrid. Within TGrid the fracture walls were “wrapped”, creating a completely enclosed 3D geometry that was then meshed using tetrahedral cells. Three volume meshes were generated with different fracture wall-roughnesses by varying the size of the triangles the original ASCII volume was wrapped with. These three meshes were then imported into GAMBIT and the fracture walls were separated by set amounts, resulting in the 15 fracture geometries used for this study. These fracture geometries were then remeshed within GAMBIT, refined within TGrid, and exported to FLUENT for CFD simulations. This procedure is shown graphically in Figure 2. The items to the left in Figure 2 involve capturing the original data and reconstructing an adequate representation of the volume while the items on the right are required to create a tractable computational mesh for detailed CFD simulations. The entire process, from data acquisition to mesh construction, is important for obtaining useful and reliable CFD results.
Figure 2. Construction flow chart
2.1. Roughness properties of fracture meshes
The Joint Roughness Coefficient (JRC) is an index from 0 to 20 that was proposed by Barton and Choubey (1977) as a method of describing the shear strength of rock fractures. Tse and Cruden (1979) developed an accurate empirical strength of rock fractures.
Table 1. Fracture mesh roughness properties
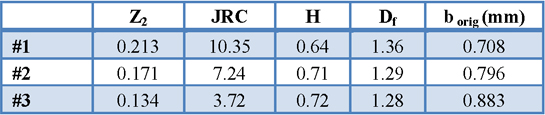
Tse and Cruden (1979) developed an accurate empirical relationship between the root-mean-square of the fracture profile wall slope, Z2, and the JRC. To determine the Z2 of a fracture profile, M measurements of the fracture surface height, y, some small distance apart, Δx, can be used,
[1] ![]()
This was determined to fit the empirical relationship by Tse and Cruden (1979).
[2] ![]()
A more common descriptor of the fracture wall-roughness is the fractal dimension, Df. The Hurst exponent, H, is related to the Df of 2D fracture profiles by Df = 2 − H. The H of a profile can be determined by using the variable-bandwidth technique (Dougan et al., 2000), where the difference in height, Δy, between two points a distance ‘s’ apart are measured and the standard deviation, σs, of this displacement is calculated,
[3] ![]()
This process is repeated for a range of s. If the fracture profile is well described by fractional Brownian motion, a non-Fickian diffusive scaling will exist between the σs and the H, such that σs ∞ sH. By plotting σs and s on a log-log plot the H can be determined from the slope of straight lines that exhibit this linear behavior. The JRC and the Df are listed in Table 1 for the three different wall-roughnesses studied.
Figure 3. (A) fracture mesh volume (B) obstructed areal fraction of the fracture plane
2.2. Varying apertures fracture meshes
It has been shown by previous experimental studies that the fracture wall-roughness has an effect on the resistance of fluids flowing through a fracture (e.g. Brown, 1989; National Research Council, 1996). Wall-roughness also creates asperities (i.e. zero-aperture regions) when the fracture walls are close. While it has been shown that these asperities will deform under high confining pressures (Gangi et al. 1996) in practice it is rather difficult to perform flow experiments in the lab with these high pressures on individual rock fractures. In addition, these high pressures will tend to permanently deform the rock surfaces. By isolating the individual fracture walls from the three previously described computational meshes we reconstructed 15 separate numerical models, with three different wall roughnesses and mean apertures of 1, 0.8, 0.6, 0.5, and 0.4 mm. The fracture volume and the areal fraction of the fracture plane that is occupied by obstructions for all 15 meshes are plotted in Figure 3. The obstructed apertures have been shown to restrict flow in fractures by previous researchers (e.g. Brown, 1989; Konzuk and Kueper, 2004) so it is worth noting that all fracture meshes with mean apertures greater than 0.5 mm had open flow domains, with less than 0.25% of the region closed to fluid flow. The volume of the fractures was observed to decrease linearly as the fracture aperture is reduced, with a slope of approximately 2.
2.3. Modeling parameters
For all geometries the computational mesh was refined to capture the details of flow. Refinement was performed until the change in mean velocity of the flow solution varied less than 1% between successive mesh refinements. The final refined cell count in each 3D fracture model varied from 2 to 5 million cells. Numerical models and methods used are identified in Crandall et al. (2009). The steady solution was deemed adequate when both the velocity residuals were less than 10−4 and less than 0.1% of the mass flux was lost due to numerical approximations.
3. Results and discussion
Water was modeled as moving through the fracture geometries due to imposed pressure gradients, ∇P. The transmissivity, T, of the fracture was measured with the following relationship,
[4] ![]()
where Q is the mass flow rate calculated through the fracture and μ is the viscosity of water (10−3 Pa*s). In a similar fashion the effective aperture, δ, of the fractures were determined with the following “cubic-law” relationship,
[5] ![]()
with the fracture width, W = 2.1 cm. These two fracture flow resistance values were used to quantify the changes in the fluid transport within the reconstructed volumes as functions of the wall roughness and the mean apertures.
3.1. Flow changes with fracture wall roughness
The changes in the δ and T with JRC and Df, are shown in Figure 4(A) and 4(B), respectively for three different wall roughnesses and a mean aperture of 0.6 mm. As can be seen from these plots, with increases in the roughness both T and δ decreased. When T and δ decrease, the resistance to fluid transport increases. Interestingly, the large change in T and δ between the two smoothest fractures, Wall Roughness #2 and #3, corresponds to a relatively large change in the JRC, unlike the small change of Df shown in Figure 4(B)
Figure 4. T and δ of fractures with an aperture of 0.6 mm as functions of (A) JRC and (B) Df.
3.2. Flow changes with fracture aperture
The changes in the transmissivity, T, and the ratio of the effective aperture to the mean aperture, δ/b, as a function of the mean aperture are shown in Figure 5. Ideally, T would be increasing as the cube of the mean aperture, and the ratio of the effective and mean aperture would be 1. Figure 5(A) shows that T does increase with increasing mean aperture. However, the fit to the ideal line becomes increasingly worse with smaller fracture apertures. This is even clearer in Figure 5(B), where the ratio of δ/b is far from 1 below apertures of 0.7 mm and gets closer to 1 (i.e. the cubic law is more applicable) as b increases and the effects of micro-scale fracture wall roughness on the fluid flow become smaller.
Figure 5. Calculated transmissivity (A) and δ/b (B) as functions of the mean aperture for fractures with a Wall Roughness #3
4. Conclusions
The following conclusions can be inferred from these studies:
– reconstruction of natural geometries from CT scans to computational volumes can alter the micro-scale properties significantly,
– alteration of micro-scale wall-roughness of rock fractures has a significant effect on fluid transport through a fracture,
– the Joint Roughness Coefficient appears to characterize small changes in micro-scale wall roughness in a way that correlates well to fluid resistance parameters,
– as the mean distance between fracture walls increases the fracture wall roughness becomes less important, and
– the transmissivity of fractures decreases more rapidly when fracture walls touch at discrete locations.
5. Acknowledgements
This research was performed while Dustin Crandall held a National Research Council Research Associateship Award at the National Energy Technology Laboratory in Morgantown, WV USA. The authors also wish to thank Zuliema T. Karpyn at Penn State University for providing the CT scanned fracture data.
6. References
Barton, N., Choubey, V., “The Shear Strength of Rock Joints in Theory and Practice”, vol.10, No.1-2, pp.1-54, Rock Mechanics, 1977.
Brown, S.R., “Transport of Fluid and Electric Current through a Single Fracture”, vol.94, No.B7, pp.9429–9438, Journal of Geophysical Research, 1989.
Crandall, D., Bromhal, G., Karpyn, Z.T., “Numerical Simulations Examining the Relationship between Wall-Roughness and Fluid Flow in Fractures”, submitted, Journal of Contaminant Hydrology, 2009.
Dougan, L.T., Addison, P.S., McKenzie, W.M.C., “Fractal Analysis of Fracture: A Comparison of Dimension Estimates”, vol.24, No.4, pp.383-392, Mechanics Research Communications, 2000.
Eker, E., Akin, S., “Lattice Boltzmann Simulation of Fluid Flow in Synthetic Fractures”, vol.65, pp.363-384, Transport in Porous Media, 2006.
Hughes, R.G., Blunt, M.J., “Network Modeling of Multiphase Flow in Fractures”, vol.24, pp.409-421, Advances in Water Resources, 2001.
Karpyn, Z.T., Grader, A.S., Halleck, P.M., “Visualization of Fluid Occupancy in a Rough Fracture Using Micro-Tomography”, vol.307, No.1, pp.181–187, Journal of Colloid and Interface Science, 2007.
Konzuk, J.S., Kueper, B.H., “Evaluation of Cubic Law Based Models Describing Single-Phase Flow through a Rough-Walled Fracture”, vol.40, pp.W02402, Water Resources Research, 2004.
National Research Council, Committee on Fracture Characterization and Fluid Flow, Rock Fractures and Fluid Flow: Contemporary Understanding and Applications, National Academy Press, Washington DC, 1996.
Tse, R., Cruden, D.M., “Estimating Joint Roughness Coefficients”, vol.16, pp.303-307, International Journal of Rock Mechanics and Mining Sciences Geomechanical Abstracts, 1979.