
Determination of 3D Displacement Fields between X-ray Computed Tomography Images Using 3D Cross-Correlation
Problems and Solutions
ABSTRACT. The difficulties associated with applying the method of cross correlation to determine the 3D displacement fields between x-ray computed tomography (x-ray CT) images are discussed in this study. The high-resolution 3D x-ray CT images of Silica sand specimens were obtained using the x-ray CT facility at Washington State University. A computer code, M-DST, was developed determine the 3D displacement fields between the x-ray CT images of the soil specimen before and after moving the specimen. Displacement fields obtained by changing the x-ray CT scan parameters as well as different computer programming approaches in M-DST code show that the effect of x-ray source fluctuation is reduced by increasing the number of images to generate radiographs. In addition, computing time is reduced significantly by defining a limited search region around the template and using running sum to calculate the 3D cross correlation.
KEYWORDS: x-ray computed tomography, cross-correlation, displacement field, M-DST
1. Introduction
Detection of the internal displacement fields for a specimen under loading in real time is important to characterize material behavior. Deformations may be observed and photographed directly for simple cases such as plane strain problems. Use of easily detectable material as markers, such as colored sand or tiny metallic spheres is commonly used to find internal displacements. Colored sand layers are usually used behind a transparent sheet and the movement of the colored particles is traced from photographs that are taken continuously as the specimen is loaded. On the other hand, instead of markers, a rectangular grid, made of horizontal and vertical lines, is plotted on the transparent sheet and the displacements of the grains are obtained by tracing the relative movement of the particles respect to the grid lines (White and Bolton 2004). Very small metallic balls or wires have also been placed inside the specimen at certain locations to quantify the internal displacement fields using radiography or X-ray CT (Nemat-Nasser and Okada 2001; Wood 2002; Alshibli and Alramahi 2006). Disturbance and changes in material properties by this method limit the calculation of 3D displacements to only small number of points.
Several different methods using image processing and computer vision techniques have been developed to quantify the 2D displacement fields. The cross-correlation method remains the most popular among them. In signal processing, cross-correlation number is a measure of the similarity between two signals. It can also be used to compare the similarity between two digital images before and after application of displacements.
Sadek et al. (2003), Liu and Iskander (2004), and several other researchers have applied the cross-correlation technique to find the 2D displacement fields on the exterior boundaries of soil specimens. This method has not been applied for 3D x-ray CT images due to some difficulties such as fluctuations of x-ray intensity with time, large sizes of 3D images, and extremely long processing time.
In this study the cross-correlation technique is extended to three dimensions and practical methods are developed to obtain 3D displacement fields from successive 3D x-ray CT images. An interactive computer program (M-DST) is developed to determine the 3D displacement fields using these techniques.
2. Cross-correlation technique for pure displacements
A small box-shaped subvolume is taken from the current image F(Xi), which is represented by ƒ(Xi). It is assumed that after applying a displacement di (with three components ui, vi, wi in x, y, and z directions, respectively) to ƒ(Xi) there is another box shaped subvolume with the same size of the template in the current image like target g(Xi), which is the same as ƒ(Xi). Normalized cross-correlation (NCC) is a measure of the similarity between ƒ and g defined by (Lewis 1995):
[1] 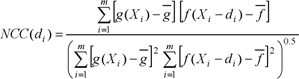
where:
NCC(di) = normalized cross-correlation as a function of displacement di
![]() average of template ƒ
average of template ƒ
![]() average of target g
average of target g
Correlation coefficients range from −1 to +1, in which +1 shows 100% similarity between template and target or both are the same; 0 means no similarity and −1 shows 100% similarity in the reverse direction. In any case, the maximum absolute value resulting from equation [1] is always considered to compare two images.
2.1. Determination of 3D displacement fields
The reference image is divided into small box-shaped subvolumes to find the displacement fields using cross-correlation techniques. The size of the subvolumes depends on many different factors such as image size, available computer memory, and accuracy. For each template ƒ in the reference image F a target g in the current image G is searched so that the normalized cross-correlation (equation [1]) is a maximum. The displacement di is determined based on the maximum similarity between two blocks. In case of significant rotations different orientations of the target must be examined to include the effect of affine deformation (displacement and rotation). This is done by using optimization techniques or robust statistical methods (Clocksin et al. 2002). However, for small rotations, rotation of the target blocks may be neglected to reduce processing time.
2.2. NCC issues and solutions
There are several issues with NCC (equation [1]) that need to be resolved before programming the method:
1. X-ray intensity fluctuates, whereas the main assumption in NCC is to use the same x-ray intensity for both reference and current images.
2. NCC is not invariant and for the repeating patterns and affine deformation the results may fail or incur large errors.
3. As shown in the last example, for every block in the template all the voxels in the target must be examined. Thus, NCC technique is extremely time consuming. For a M×N×P voxel reference image and a Q×R×S voxel current image, NCC is calculated M×N×P×Q×R×S times. For instance for a 300×300×500 voxel reference image and the same current image size, NCC is calculated 2.025×10¹⁵ times to find the displacement at every voxel. Besides, several times this number is needed for the total suite of operations, which requires a tremendous amount of CPU time.
The following solutions are provided to overcome the above issues:
1. Use of the average of several different frames (x-ray snap shots) for each single digital radiograph and increasing the number of averaged frames smoothes the x-ray intensity fluctuation so that it can be assumed to be of constant intensity with a good accuracy. To reduce the effect of x-ray beam fluctuations, it is recommended to use at least an average of 64 frames per radiograph.
2. Displacements on soil specimens can be applied in small steps. When a fixed axis test such as triaxial is used the rotation of the blocks are small as well. Sand particles are different and irregular in shape, which means that no repeating pattern is expected for an image with sufficient resolution to separate the particles.
3. When there is no information about displacements all the voxels in the current image should be searched. However, displacements of the blocks may be estimated based on the external radial and axial displacements in triaxial tests. Therefore, to reduce the processing time a subvolume around a particular block from target is extracted to search for the maximum NCC within that small subvolume. Use of fast NCC algorithms (Lewis 1995; Eaton 2005) reduces the processing 20 times and even more. Finally, use of parallel processing is recommended to further reduce the processing time.
3. An interactive computer code to find 3D displacement fields
An interactive computer code (M-DST) was developed to find the displacement fields by comparing template and target images using the NCC technique in a MATLAB environment (Razavi 2006). M-DST takes advantage of successive data write and read on the hard disk drive to process large volumes. In this way only the necessary portion of the image is loaded from the hard disk drive to the random access memory (RAM). After completing the operations, the results are saved on the hard disk drive and deleted from RAM to provide sufficient free space for the next image portion.
3.1. Determination of 3D displacement fields using M-DST
Silica 30-40 sand specimens (US Silica Company) with an average particle diameter of 1.6 mm were prepared (Gs=2.70) in an acrylic cylindrical mold, 27.82 mm in diameter and 150.62 mm in height. They were compacted in five layers by tamping on the sides of the mold. All of the specimens were scanned using x-ray CT at Washington State University High-Resolution X-ray CT Lab and their 3D images obtained by using a current of 0.284 mA, an x-ray beam energy of 160 keV, and 64 frames per radiograph (each radiograph is an average of 64 images).
Several preliminary scans were performed to choose the optimum magnification to attain the best resolution within the constraints of the computer memory and the capability to process the images. Based on repeated trials, it was found that a magnification of 3.1 times was sufficient.
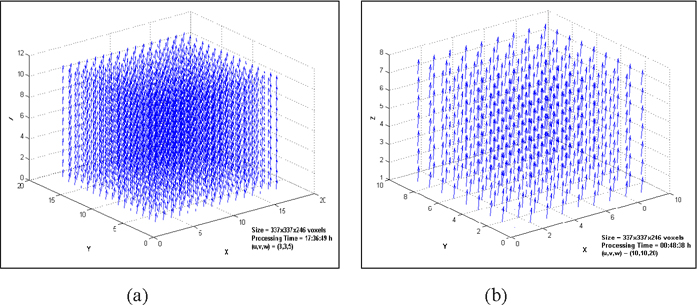
Different tests were used to verify the computer code. In the first, the current image is generated by applying known displacements to the reference image. Then the displacements of the reference image are determined by the program and the results are compared. Figure 1.a shows the displacement fields of a 3D x-ray CT image after a translation of 3, 3, and 5 pixels in X, Y, and Z directions.
(The volume size is 337×337×246 voxels and the total processing time on a 3.2 GHz dual processor Pentium IV machine is about 17 hours. In this particular problem template size is 35×35×35 voxels, search radius is 60 pixels and the displacements are determined for 20 voxels intervals with 100% similarity threshold).
The results of M-DST are exactly the same as imposed displacements. To check the program for larger displacements, the 3D x-ray CT image is translated 10, 10, and 20 pixels in X, Y, and Z directions, respectively. The results are shown the Figure 1.b, which are identical to the imposed displacements. (To reduce the processing time, the search radius is reduced to 25 pixels and the displacements are determined for 35 voxels intervals. The other parameters in the program remained unchanged. These changes reduce the processing time significantly to 00:48:38 hours using the same machine.)
In case of rotation of template blocks, M-DST determines rotation pattern correctly, but there is a significant error in displacement values. In this case M-DST could not find any template and target blocks to have a similarity more than 95%. It means that for significant rotations considerable error is expected, though pattern of the displacement fields seems to be valid.
Figure 1. (a) Determined 3D displacement fields for imposed displacements of 3, 3, and 5 pixels in X, Y, and Z directions, respectively (search radius is 60 pixels); (b) determined 3D displacement fields for imposed displacements of 10, 10, and 20 pixels in X, Y, and Z directions, respectively (search radius is 20 pixels).
4. Conclusions
The method of template matching to find the 2D displacement fields between two 2D digital photographs was extended to find the 3D displacement fields between two 3D x-ray CT images. An interactive computer program (M-DST) was developed to process two 3D CT images, find the displacement fields, and represent it as a vector field or contour plots in three different planes.
The major problems with extension of the correlation method for 3D x-ray CT images are fluctuations of the x-ray beam, limited computer memory to process two 3D x-ray CT images simultaneously, and extremely long computing time. Fluctuation of the x-ray intensity was fixed using large numbers of averaging captured frames to form each digital radiograph. To overcome to the memory problem with loading of two 3D x-ray CT images at the same time, the method of successive read and write on the hard disk drive was applied. Instead of searching the whole voxels of the current image, a search region is defined in the computer code and in this way only the part of the image, which is required for processing, is loaded in memory to avoid memory overflow. To speed up the processing time, the computer code was developed so that user can install it on as many as machines he wants to find the displacement fields for each part individually. The results for each part are put together to have the displacement fields for the whole image.
5. Acknowledgements
The study presented in this paper was sponsored by the National Science Foundation under the grants CMS-0116793 and CMS-0010124 to Washington State University. The x-ray CT system was established from funds contributed by the National Science Foundation, Murdock Charitable Trust Fund, and Washington State University. The authors gratefully acknowledge the support of these agencies.
6. References
Alshibli, K. A., and Al Ramahi, B., “Microscopic evaluation of strain distribution in granular materials during shear”, Journal of Geotechnical and Geoenvironmental Engineering, vol. 132, no. 1, p. 80-91, 2006.
Clocksin, W. F., Quinta Da Fonseca, J., Withers, P. J., and Torr, P. H. S., “Image processing issues in digital strain mapping”, Proceedings of SPIE-The International Society for Optical Engineering, vol. 4790, p. 384-395, 2002.
Dennis M. J., “Industrial computed tomography”, Reprinted from Metals Handbook, vol. 17, p. 358–386, 1989.
Eaton D., “Fast NCC”, http://www.cs.ubc.ca/∼deaton/remarks_ncc.html, 2005.
Haralick, R. M. and Shapiro, L. G., Computer and Robot Vision, vol. II, Addison-Wesley Inc., 1993.
Kak, A. C., and Slaney, M., Principle of Computerized Tomographic Imaging, Siam, Philadelphia, 2001.
Liu, J. and Iskander, M., “Adaptive cross correlation for imaging displacements in soils”, Journal of Computing in Civil Engineering, vol. 18, no. 1, p. 46-57, 2004.
Lewis, J. P., “Fast normalized cross-correlation”, Industrial Light & Magic, http://www.idiom.com/∼zilla/Papers/nvisionInterface/nip.html, 1995.
Nemat-Nasser, S. and Okada, N., “Radiographic and microscopic observation of shear bands in granular materials”, Geotechnique, vol. 51, no. 9, p. 753-765, 2001.
Razavi, M., Characterization of Microstructure and Internal Displacement Field of Sand using X-ray Computed Tomography, PhD Thesis, Washington State University, Pullman, WA, USA, 2006.
Sadek, S., Iskander, M., and Liu, J., “Accuracy of digital image correlation for measuring deformations in transparent media”, Journal of Computing in Civil Engineering, vol. 17, no. 2, p. 88-96, 2003.
White, D. J., and Bolton, M. D., “Displacement and strain paths during plane-strain model pile installation in sand”, Geotechnique, vol. 54, no. 6, p. 375-397, 2004.
Wood, D. M., “Some observations of volumetric instabilities in soils”, International Journal of Solids and Structures 39, Pergamon, p. 3429-3449, 2002.