
Sand Deformation at the Grain Scale Quantified Through X-ray Imaging
ABSTRACT. This paper presents a study of localized deformation processes in sand with grain-scale resolution. Our approach combines state-of-the-art x-ray micro tomography imaging with 3D Volumetric Digital Image Correlation (3D V-DIC) techniques. While x-ray imaging and DIC have in the past been applied individually to study sand deformation, the combination of these two methods to study the kinematics of shear band formation at the scale of the grains is the first novel aspect of this work. Moreover, we have developed an original grain-scale V-DIC method that enables the characterization of the full kinematics (i.e. 3D displacements and rotations) of all the individual sand grains in a specimen. We present results obtained with both “continuum” and “discrete” DIC on Hostun sand, and a few preliminary results (continuum DIC only) recently obtained on ooid materials, which are characterized by spheroidal, layered grains.
KEYWORDS: strain localization, granular media, in-situ x-ray tomography, 3D volumetric digital image correlation
1. Introduction
Shear banding, the localization of deformation into thin zones of intense shearing, is a phenomenon commonly observed in sand and other granular materials. It has quite a practical relevance from an engineering standpoint, and has been thoroughly investigated in the laboratory for decades. However, it should be kept in mind that in the presence of localized deformations, the meaning of stress and strain variables derived from boundary measurements of loads and displacements is only nominal. Therefore, the most valuable experimental contributions to the understanding of shear banding are those measuring, in one way or another, the full field of deformation in the specimen – which is the only means by which test results can be appropriately interpreted (Viggiani and Hall 2008). Full-field analysis of strain localization in sand possibly started in the late 1960s in Cambridge (e.g. Roscoe et al. 1963), and was continued over the last decades in the work of a number of groups, including Grenoble; see Desrues and Viggiani (2004) for a review. Most of these works were performed using specifically designed plane strain devices, and used a range of full-field methods, the more advanced of which allowed observation of the specimen throughout loading by optical methods, thereby permitting measurement of the evolving strain field. In the 1960s, x-ray radiography was first used to measure 2D strain fields in sand (e.g. Roscoe 1970). From the early 1980s, x-ray tomography was used by Desrues and coworkers (see Desrues 2004 for a review) and later by Alshibli et al. (2000). These studies provided valuable 3D information on localization patterning in sand, and also demonstrated the potential of x-ray tomography as a quantitative tool, e.g. for measuring the evolution of void ratio inside a shear band and its relation to critical state (Desrues et al. 1996).
The recent advent of x-ray micro tomography, originally with synchrotron sources and now with laboratory scanners, has provided much finer spatial resolution, which opens up new possibilities for understanding the mechanics of granular media (in 3D) at the scale of the grain. For example, Oda et al. (2004) presented micro tomography images of sand grains inside a shear band, showing organized structures that would not have been seen in standard x-ray tomography images (because of insufficient resolution) and that had only previously been observed in 2D thin sections (Oda and Kazama 1998).
It should be noted that the images by Oda et al. (2004) were obtained postmortem, i.e. after testing. However, a full understanding of the mechanisms of (localized) deformation can only be achieved if the entire deformation process is followed throughout a test while the specimen deforms. This is possible by using in-situ x-ray tomography (in-situ meaning x-ray scanning at the same time as loading). A number of such in-situ studies for triaxial tests on sand were performed using medical or industrial tomography systems (e.g. Desrues et al. 1996, Alshibli et al. 2000, Otani et al. 2002). More recently, Matsushima et al. (2006, 2007) have used synchrotron x-ray in-situ micro tomography, which allowed them to identify individual sand grains and track their displacements throughout a triaxial test – note that this tracking was carried out only in 2D for a section through the specimen.
The aim of the study presented in this paper was both to observe the material evolution under loading with grain-scale resolution and to image the deformation processes. In recent work, presented at the previous GeoX workshop (Bésuelle et al. 2006), we applied 3D Volumetric Digital Image Correlation (V-DIC) to a sequence of x-ray tomography images taken during a triaxial test on a clay-rock specimen (see also Lenoir et al. 2007). In the present paper, we show results of a similar DIC-based analysis of deformation for sand specimens under triaxial compression. Two different granular materials were tested: Hostun sand, a fine-grained, angular siliceous sand with a mean grain size (D50) of about 300 µm, and Caicos ooid, a material characterized by spheroidal grains with D50 of about 420 µm. In addition, we have developed a grain-scale V-DIC method that permits the characterization of the full kinematics (i.e. 3D displacements and rotations) of all the individual grains in a specimen. So far, such a method has been applied only to Hostun sand.
The structure of the paper is as follows. First, we describe the experimental setup for triaxial testing with concurrent x-ray micro tomography. We then describe the main features of the two V-DIC methodologies (continuum and discrete) used in this study. Results obtained with both methods are presented and discussed for a triaxial compression test on Hostun sand. For the tests on Caicos ooid, the analysis is still ongoing, and the evolution of full-field incremental kinematics has been obtained only from the continuum V-DIC. For both materials, distinct features of localized deformation are identified and their spatial and temporal development is characterized.
2. Experimental setup, testing program and materials tested
The experimental results presented in this work come from two testing programs. The former, on Hostun sand, was carried out on beamline ID15A at the European Synchrotron Radiation Facility (ESRF) in Grenoble; results of such program have already been presented elsewhere (Hall et al. 2009, 2010a). The latter, on Caicos ooid, was carried out using the multi-scale x-ray CT scanner recently acquired at Laboratoire 3S-R, which was designed and manufactured by RXSolutions at Annecy, France (see Figure 1). In this laboratory scanner, a large cabin allows for the flexible working space that is needed to perform in-situ scanning. Spatial resolution can be adjusted by changing the spot size and by moving the rotation stage, thus changing the distance between the x-ray source and the object to be scanned (the distance between source and detector remaining the same). Both at the ESRF and at 3S-R, x-ray micro tomography allowed for high spatial resolution (in the order of a few microns), which is crucial for understanding mechanics down to the grain scale. It should be noted that, for a given spatial resolution, using a synchrotron source provides very fast scanning thanks to the high photon flux (12 minutes for a scan of the entire sample, as opposed to about 3 hours for our laboratory x-ray scanner).
Figure 1. X-ray CT scanner at Laboratoire 3S-R. Overall view of the large cabin (internal dimensions: height 290 cm, width 175 cm, depth 135 cm) and remote computer control (left photograph), and main components of the system (right photograph)
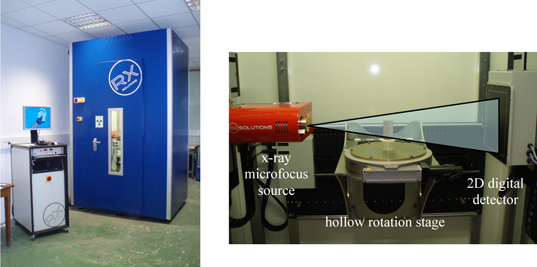
Figure 2. Tomography set-up for triaxial testing at the beamline ID15A at ESRF. Complete set-up on the beamline (left photograph) and zoom on the specimen inside the triaxial cell (right photograph)
The tests were conducted using a specifically built in-situ setup that could be placed in the x-ray beam allowing the specimens to be scanned under load, see Figure 2. The triaxial apparatus, made from Plexiglas (very transparent to x-rays), is practically the same as a conventional system, except the much smaller size and the shape of the confining cell. As opposed to conventional triaxial systems, the tensile reaction force is carried by the cell walls and not by tie bars (which avoids having any obstacles to the x-rays). The axial load and hence the stress deviator are applied using a motor-driven screw actuator, which also does not interfere with the tomographic x-ray scans. See Lenoir (2006) and Viggiani et al. (2004) for full details. Note that essentially the same setup was used in the experiments at the ESRF and at 3S-R, except for the fact that the loading system is above the cell in the former case, and below in the latter (i.e. the axial piston moves upward during deviatoric loading).
Several triaxial compression tests were performed on dry specimens of Hostun sand and Caicos ooid. Results from just two tests are discussed herein, both performed under a confining pressure of 100 kPa. Both materials were tested starting from an initially dense packing, obtained by dry pluviation. Deviatoric loading was strain controlled, with a screw driven piston moving at 60 µm/min, which corresponds to quite a low strain rate (0.27%/min for a 22 mm high specimen). As in conventional triaxial testing, the specimen slenderness was equal to 2, i.e. the diameter of the specimen was 11 mm. It should be noted that despite the small sample size (in comparison to standard triaxial tests on sands), the specimen can be considered large enough to be mechanically pertinent (i.e., its response can be considered representative of that of a larger mass of the material); in fact the sample comprises roughly 50,000 grains for Hostun sand and 20,000 for Caicos ooid. These reduced dimensions were imposed by the x-ray imager width at the ESRF, which was just 14 mm (the sample needed to be smaller than this to not risk passing out of the field of view, although this did occur by the end of the test on Hostun sand; see later). The spatial resolution (i.e. the voxel size) was set to 14×14×14 µm3 at the ESRF, while it was slightly larger for the experiment on Caicos ooid performed in the scanner at 3S-R (where the side of the voxel was 14.7 µm). Such a resolution was enough to clearly identify the individual grains of both materials tested. As an example, Figure 3 shows two tomographic slices obtained from scanning a specimen of Hostun sand at the ESRF and at 3S-R (recall that the mean grain size of Hostun sand is around 300 µm or about 20 voxels; therefore each grain contains about 5500 voxels in the tomography images). Interestingly, the quality of the two slices looks very much comparable at first glance. However, important differences may exist between them (for example in terms of the signal-to-noise ratio, which is lower in the ESRF images because unfortunately scanning parameters were not optimized), which are all but “minor details” when it comes to quantitative image processing, e.g. digital image correlation.
As for the materials tested, Hostun sand can be considered relatively well-known, as it has been the reference sand for our laboratory as well as many other research groups in Europe. It is a fine-grained, angular siliceous sand coming from the Hostun quarry (Drôme, France). A uniform gradation of the natural sand (so-called Hostun RF, or S28 Hostun) was used in the testing program, with 100% of the material passing a 0.63 mm sieve and retained on a 0.16 mm sieve. The mean particle diameter is 0.30 mm and the coefficient of uniformity (Cu = D60/D10) is 1.70.
The ooid material has been provided by the Resource Sciences Laboratory of ExxonMobil Research and Engineering Co., Anandale (USA). The material was collected from the Caicos platform, which is the southernmost platform of the Bahamian archipelago that has significant emergent islands. More precisely, the material tested comes from a region there described as Ambergris Shoal, which is a marine shoal depositional environment. Ooids are rounded, “coated” (layered) sedimentary grains that are essentially pure CaCO3. X-ray diffraction indicates that they are <96% aragonite, the remainder being calcite and high magnesium calcite. The grains are composed internally of concentric spherical layers that build out from a single core. The gradation used in this testing program is relatively uniform, with 100% of the grains passing a 0.60 mm sieve and retained on a 0.18 mm sieve. The mean particle diameter is 0.42 mm and the coefficient of uniformity is 1.90.
Figure 3. Horizontal slices extracted from 3D x-ray micro tomography images of a specimen of Hostun sand obtained at the beamline ID15A at ESRF (left) and at 3S-R (right)
3. Continuum and discrete volumetric digital image correlation
Digital Image Correlation (DIC) is a method that is being used increasingly in experimental solid mechanics to measure displacement and deformation fields over surfaces (e.g., Pan et al. 2009) or through a volume (e.g., Bay 2008). While the method was pioneered in the 1980s, its extension to measure displacement and strain fields within solid objects, e.g., using 3D images acquired by x-ray tomography, is more recent (e.g., Bay et al. 1999, Bornert et al. 2004, Lenoir et al. 2007; see Bay 2008 for a review).
Whatever dimension (2D or 3D), DIC is a mathematical tool to define the best mapping of an image into another. More precisely, the aim is to determine the transformation Φ that relates reference and deformed configurations of an evolving system. The method is based on the fundamental assumption that at any point x the grey levels in the first image, f(x), are convected into the grey levels of the second image, g(x), by the transformation Φ, that is, g(Φ(x)) = f(x). In practice this relation is never fully satisfied, because of systematic and random noise. For the case of images acquired by x-ray micro tomography, random noise can be high and systematic reconstruction artifacts are often present.
Implementations of DIC usually involve local evaluations of the transformation Φ over cubic (for the volume case) subsets that are regularly distributed over the reference image. The evaluation requires solving an optimization problem for each subset, in which essentially some measure of the similarity of f(x) and g(Φ(x)) in the considered subset is maximized over a parametric set of transformations. As a digital image is a discrete representation of grey levels, any integral over subsets is in fact discretized into a sum over voxels. Some interpolation is therefore necessary to evaluate the transformation with subvoxel accuracy; see Lenoir et al. (1997) for further details.
It should be noted that standard implementations of the approach described above assume a continuous displacement field, at least within each subset. Locally, the transformation is assumed to be a rigid translation, or a low order (usually linear or quadratic) polynomial expansion of the actual transformation. When deriving strain from the displacements of separate subsets, continuity between subsets is assumed. For this reason, we refer to this DIC analysis as “continuum DIC”. Such a procedure can be applied to study the deformation of a granular material such as sand as long as the spatial scale of the investigation remains large with respect to the grain size. It may also be used at somewhat smaller scales (a few grains within the correlation subsets) under the condition that only small deformation increments are considered. However, a different DIC approach is possible, which recognizes the granular character both of the images and the mechanical response, and has therefore the specific objective of investigating the kinematics of individual sand grains. In this work, a “discrete DIC” procedure has been developed with the specific aspect that the regularly shaped and spaced subsets are replaced by subsets centered on each individual grain, with a shape following the actual shape of the grain. In practice, the subsets include a grain plus a small surrounding layer a few voxels thick. The reason for this layer is that, possibly because of the relatively high noise level in the x-ray images and almost uniform x-ray absorption of the sand grains, the grey level variation within a grain was not enough for DIC. Adding a layer provided the extra information of grain shape, which is characteristic of each individual grain. If the grains are assumed to be rigid, then the transformation of each subset is a rigid motion, i.e. it involves a three component translation vector plus a rotation. The latter is represented by a rotation axis and a positive angle of rotation about this axis (the axis is parameterized by two polar angles, a longitude with respect to the specimen axis, and a latitude in the cross-sectional plane).
The practical implementation of this Discrete DIC comprises four consecutive steps. First, the image of the undeformed specimen is segmented in order to identify and label individual grains. Then, a mask is defined for each grain, covering the grain plus a three-voxel wide layer around the grain. Standard DIC procedures of CMV-3D are then applied to determine a first evaluation of the translation of each grain, making use of sufficiently large cubic subsets centered on the grains. Finally, starting from these initial estimates, the translation and rotation of each grain are determined using the discrete DIC algorithm. See Hall et al. (2010a) for further details.
In the following, we present results obtained using both continuum and discrete V-DIC. The former uses the code TOMOWARP, which is based on the work of Hall (2006) (see also Hall et al. 2010b for a 2D application to a granular material). Discrete V-DIC has been integrated into CMV-3D, a code developed by Bornert et al. (2004) (see also Lenoir et al. 2007 for further details and an application to geomechanics).
4. Selected results
4.1. Hostun sand
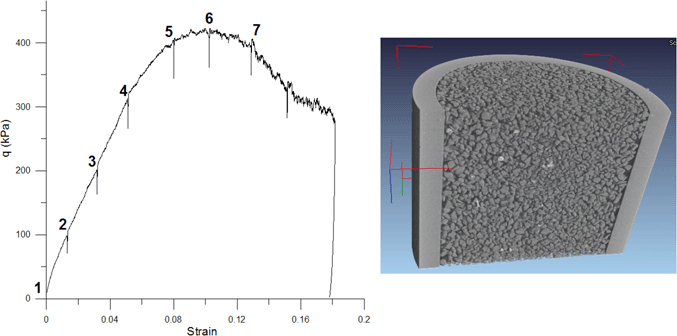
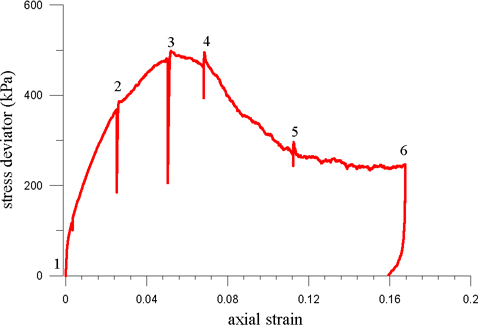
X-ray tomography scans were carried out at key moments throughout the test, which are marked by (small) relaxations in the loading curve in Figure 4. The sample stress-strain response shows a roughly linear initial trend followed by a curvature to the peak stress at around 11% nominal axial strain, after which the stress drops, to what is probably the beginning of a plateau, after which the test was stopped and the sample unloaded.
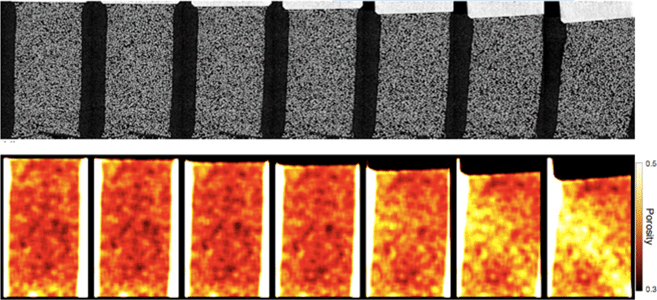
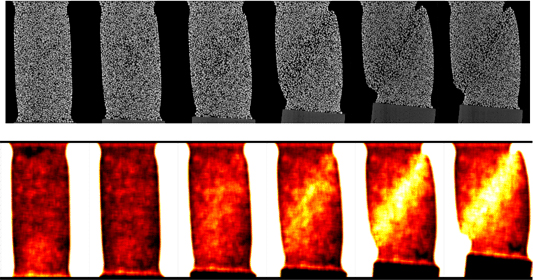
The image on the right in Figure 4 shows in 3D the grain detail which is possible to obtain for Hostun sand through x-ray tomography. For the sake of clarity, in the following we will show only 2D slices through this volumetric data and the subsequent V-DIC results. The top row of Figure 5 shows a series of vertical slices through the x-ray tomography images at different stages in the test (see stress-strain curve in Figure 4). These slices, which are roughly perpendicular to the planar band of localized strain that developed during the test, show that the specimen gradually leans to one side, with a rotation of the upper platen in the latter part of the test. However, there is no clear evidence of localized deformation in these images. Porosity maps shown in the bottom row of Figure 5 were obtained from the grey-scale images based on overlapping cubic windows of side 61 voxels (854 µm) throughout the sample volume. From these porosity fields an evolving inclined zone of localized dilation can be seen.
Figure 4. Stress deviator versus axial strain curve for the deviatoric loading part of the triaxial compression test on Hostun sand (left) and 3D rendering of the sand specimen showing the grain detail (right)
Continuum V-DIC has been carried out on consecutive pairs of 3D images to provide the incremental displacement and strain fields (the results are thus averages over the given time interval). The key DIC parameters are the distance between the calculation nodes (which also represents the reference length for subsequent strain calculation) and the correlation window size; in this analysis these were, respectively, 20 voxels (or 280 µm) and a cube with sides of 21 voxels (or 294 µm) reduced to 11 voxels (or 154 µm) for the sub-voxel derivation. Results from this analysis indicate that, despite the granular nature of the material, smooth and relatively continuous displacement fields are measured. Figure 6 shows vertical slices through the 3D field of maximum shear strain (ε1 – ε3)/2 (where ε1 and ε3 are the major and minor principal strains) for increments 3-4, 4-5, 5-6 and 6-7. These strain images clearly show the evolution of a localized band that traverses the sample diagonally from top left to bottom right. It is worth noting that this is an incremental analysis, therefore indicates the deformation active in each strain increment. This is different from what can be seen with accumulated porosity changes shown in Figure 5. As such it is seen from these incremental maps that the localization possibly initiated in increment 4-5, and was clearly developed in 5-6, i.e. before the peak load. Note that localization is visible in these maps before it becomes clear in the porosity images (bottom row of Figure 5). The general picture is of a localization of shear strain and dilatancy which starts as a broad zone and then progressively thins with loading. In increment 6-7, this zone has a width of about 5 mm (i.e. about 17 D50). It is also clear that the localized zone is not uniform, showing a degree of structure.
Figure 5. Vertical slices extracted from the seven 3D x-ray micro tomography images of the sand specimen acquired throughout the triaxial compression (top row) and equivalent slices through the 3D volumes of calculated porosity (bottom row). For scale, remember that the initial sample diameter was 11 mm.
Discrete V-DIC has been applied to provide incremental analysis of grain kinematics. Following the procedure detailed earlier, for each sand grain in the specimen a set of six scalar quantities (three displacements and three rotations) describing the kinematics of the grain has been determined. From these results, displacement components at any position within a grain can be deduced. Despite these results having been derived from a discrete analysis, they indicate a relatively continuous field of displacements, even in the presence of strain localization, which explains why continuum V-DIC performs well; see Hall et al. (2010a).
However, locally (i.e. at the scale of the grain contact) the field can be discontinuous. It should kept in mind that individual grains are identified through image segmentation, and it is well possible that grains that are in contact will not appear so as they have been artificially separated. Therefore, we cannot differentiate from such segmented images grains that are in contact from those that are not. A more detailed study of grain contact evolution in space and time would require defining contacts based on the original, non-segmented images (see the paper by Hall et al. in this volume, which gives a snapshot of work in progress in our group).
Figure 6. Continuum V-DIC derived incremental maximum shear strains (as defined in text) for increments 3-4, 4-5, 5-6 and 6-7 (previous increments showed much the same picture as 3-4). The images show vertical slices through the shear strain volume near the middle of the specimen at an equivalent position to Figure 5.
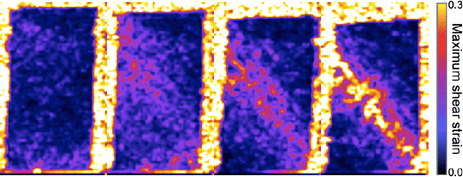
Figure 7. Discrete V-DIC derived incremental grain rotations for increments 3-4, 4-5, 5-6 and 6-7. The magnitude of grain rotations is plotted for vertical slices through the middle of the specimen at an equivalent position to Figure 6; note that the grains are plotted in the configuration at the start of the test for all increments. Grains colored grey are those for which the image correlation was not successful and those colored white are those with a rotation above a threshold value of 20°.
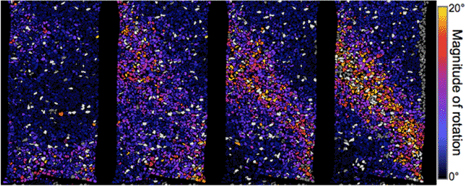
Figure 7 shows, for increments 3-4, 4-5, 5-6 and 6-7, the magnitude of rotation for each grain about its rotation axis (recall this is specific for a grain) in a vertical slice corresponding to the middle of the specimen, as in Figure 6. Note that the grains in Figure 7 are represented in the configuration that existed at the beginning of the test, and not in their displaced positions. These images indicate that grain rotations become progressively more intense into a zone that roughly corresponds to where shear strain localizes (see Figure 6).
4.2. Caicos ooid
As for the test on Hostun sand, x-ray tomography scans were carried out at key moments throughout the test – marked by relaxations in the loading curve in Figure 8. The sample stress-strain response shows a well-defined peak stress at around 6% nominal axial strain, after which the stress drops to a plateau; the test was stopped at about 17% axial strain and the sample unloaded.
Figure 8. Stress-strain response from the triaxial compression test on Caicos ooid
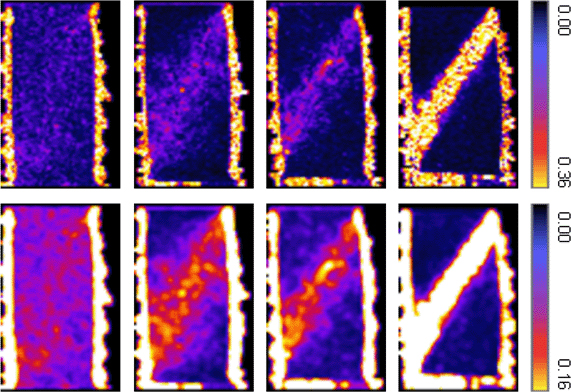
The top row of Figure 9 shows a series of vertical slices through the x-ray tomography images at different stages in the test (see stress-strain curve in Figure 7). These slices are roughly perpendicular to the planar band of localized strain that developed during the test. Differently from what was observed for the test on Hostun sand (see Figure 5), the shear band is clearly visible on these images – starting from post-peak slice 5, and possibly already in slice 4, i.e. immediately after the stress deviator peak. However, the corresponding porosity maps (shown in the bottom row of Figure 9) clearly indicate an evolving inclined zone of localized dilation in the specimen.
Figure 9. Vertical slices extracted from the six 3D x-ray micro tomography images of the specimen acquired throughout the triaxial compression (top row) and equivalent slices through the 3D volumes of calculated porosity (bottom row)
Continuum V-DIC was carried out for this test, the values of the key DIC parameters (distance between the calculation nodes and correlation window size) being the same as for the analysis on Hostun sand. Figure 10 shows vertical slices through the 3D field of maximum shear strain for increments 1-2, 2-3, 3-4 and 4-5. The bottom row results have been smoothed, which yields lower values of the maximum shear strain but also better shows some details of the inner structure of the shear band prior to and around the peak. As it was the case for the test on Hostun sand, these strain images clearly show the evolution of a localized band that traverses the sample diagonally. Again, localization initiated in increment 2-3, i.e. before the peak load; the general picture is of a localization of shear strain and dilatancy which starts as a broad zone and then progressively thins with loading. It is also clear that the localized zone in this test on Caicos ooid shows a lower degree of structure as compared to that observed in the test on Hostun sand.
Figure 10. Continuum V-DIC derived incremental maximum shear strains for increments 1-2, 2-3, 3-4 and 4-5. The images show vertical slices through the shear strain volume near the middle of the specimen at an equivalent position to Figure 9. Results shown on bottom row have been smoothed
5. Conclusions
The objective of this work was to observe and quantify the onset and evolution of localized deformation processes in granular materials with grain-scale resolution. The key element of our approach is combining state-of-the-art x-ray micro tomography imaging with 3D Volumetric Digital Image Correlation techniques. This allows not only to view the grain scale details of a deforming sand specimen, but also and more importantly to assess the evolving 3D displacement and strain fields throughout loading.
The application of continuum V-DIC has allowed the development of a localized shear band to be characterized throughout a test. Incremental analysis of consecutive steps reveals that strain localization begins before the peak stress, and indicates a diffuse, wide band progressively thinning after peak. It also appears that the shear band contains a narrower internal core of much higher strain, and that within the band there are aligned zones of either reduced or elevated strains at angles “conjugate” to the main band direction. The degree of such structure seems related to the nature/shape of the grains.
The results obtained so far using the discrete V-DIC confirm the importance of grain rotations associated with strain localization. A clear correspondence can be established between the zones of the specimen experiencing localization of (continuum) shear strain and the zones where grain rotations are more intense. A deeper analysis of continuities/discontinuities at grain contacts and their evolution is now possible, and will be investigated in future work.
In constitutive modeling, one must understand the physics governing material behavior – from the micro scale to the continuum scale. This is particularly true when modeling emergent fine-scale mechanisms whose characteristic length scales are only a few particles wide, e.g. shear bands. With the tools we have presented in this paper, we now have the capability to capture experimentally and at a pertinent level of resolution the details of grain-scale processes, including those that underlie the localization phenomena of interest here. However, the potential of the approach has still to be fully exploited. Future directions of this research include more detailed analysis of: effects of the grains shape (e.g. angularity and aspect ratio of the grains); kinematics across grain contacts and its evolution with strain localization at the macro scale; emergence of grain-scale structures inside a shear band (e.g. the “columns” of aligned grains observed by Oda et al. (2004) and also advocated by Rechenmacher (2006) based on continuum 2D DIC); organized kinematics, in particular grain rotation, at the onset of shear banding and through its evolution.
This work was carried out within the framework of the project MicroModEx funded by the French research agency, ANR (contract number: ANR-05-BLAN-0192). We acknowledge M. Di Michiel from the ESRF for his invaluable contribution to the x-ray CT experimental program, and M. Bornert and Y. Pannier at LMS (Paris) who carried out the discrete DIC analysis. C. Rousseau and N. Lenoir (formerly at Laboratoire 3S-R) are also acknowledged for their contributions to the experimental program. Finally, H.E. E. King from ExxonMobil Research and Engineering Co. is acknowledged for providing the ooid material and financial support of the experiments carried out at 3S-R.
6. References
Alshibli, K.A., Sture, S., Costes, N.C., Franck, M.L., Lankton, M.R., Batiste, S.N., Swanson, R.A., “Assessment of localized deformation in sand using X-ray computed tomography”, Geotechnical Testing J., vol. 23, 2000, p. 274-299.
Bay, B.K., “Methods and applications of digital volume correlation”, J. Strain Analysis, vol. 43, 2008, p. 745-760.
Bay, B.K., Smith, T.S., Fyhrie, D.P., Saad, M., “Digital volume correlation: three-dimensional strain mapping using X-ray tomography”, Experimental Mechanics, vol. 39, 1999, p. 217-226.
Bésuelle, P., Viggiani, G., Lenoir, N., Desrues, J., Bornert, M., “X-ray Micro CT for Studying Strain Localization in Clay Rocks under Triaxial Compression”, Advances in X-Ray Tomography for Geomaterials, 2006, ISTE, London, p. 35-52.
Bornert, M., Chaix, J.M., Doumalin, P., Dupré, J.C., Fournel, T., Jeulin, D., Maire, E., Moreaud, M., Moulinec, H., “Mesure tridimensionnelle de champs cinématiques par imagerie volumique pour l’analyse des matériaux et des structures”, Instrum. Mes. Metrol., vol. 4, 2004, p. 43-88.
Desrues, J., “Tracking strain localization in geomaterials using computerized tomography”, Proc. 1st Int. Workshop on X-ray Tomography for Geomaterials, 2004, Balkema, p. 15-41.
Desrues, J., Chambon, R., Mokni, M., Mazerolle, F., “Void ratio evolution inside shear bands in triaxial sand specimens studied by computed tomography”, Géotechnique, vol. 46, 1996, p. 527-546.
Desrues, J., Viggiani, G., “Strain localization in sand: an overview of the experimental results obtained in Grenoble using stereophotogrammetry”, Intern. J. for Num. and Anal. Methods in Geomechanics, vol. 28, 2004, p. 279-321.
Hall, S.A., “A methodology for 7D warping and deformation monitoring using time-lapse seismic data”, Geophysics, vol. 71, 2006, p. 21-31.
Hall, S.A., Bornert M., Desrues J., Pannier Y., Lenoir N., Viggiani, G., Bésuelle, P., “Discrete and Continuum analysis of localised deformation in sand using X-ray micro CT and Volumetric Digital Image Correlation”, Géotechnique, in print, 2010a.
Hall, S.A., Lenoir N., Viggiani G., Bésuelle P., Desrues J., “Characterisation of the evolving grain-scale structure in a sand deforming under triaxial compression”, this volume, 2010.
Hall, S.A., Lenoir N., Viggiani G., Desrues J., Bésuelle P., “Strain localisation in sand under triaxial loading: characterisation by x-ray micro tomography and 3D digital image correlation”, 1st Int. Symp. on Computational Geomechanics, 2009, IC2E, p. 239-247.
Hall, S.A., Muir Wood, D., Ibraim, E., Viggiani, G., “Image analysis and internal patterning in tests on an analogue granular material”, Granular Matter, accepted, 2010b.
Lenoir, N., Comportement mécanique et rupture dans les roches argileuses étudiés par micro tomographie à rayons X, PhD thesis, Joseph Fourier University, Grenoble, 2006.
Lenoir N., Bornert M., Desrues J., Bésuelle P., Viggiani G., “Volumetric digital image correlation applied to X-ray micro tomography images from triaxial compression tests on argillaceous rocks”, Strain, vol. 43, 2007, p. 193-205.
Matsushima, T., Uesugi, K., Nakano, T., Tsuchiyama, A., “Visualization of grain motion inside a triaxial specimen by micro X-ray CT at SPring-8”, Advances in X-Ray Tomography for Geomaterials, 2006, ISTE, London, p. 35-52.
Matsushima, T., Katagiri, J., Uesugi, K., Nakano, T., Tsuchiyama, A., “Micro X-ray CT at SPring-8 for granular mechanics”, Soil Stress-Strain Behavior: Measurement, Modeling and Analysis, 2007, Springer, Netherlands, p. 225-234.
Oda, M., Kazama, H., “Microstructure of shear band and its relation to the mechanism of dilatancy and failure of granular soils”. Géotechnique, vol. 48, 1998, p. 465-481.
Oda M., Takemura T., Takahashi, M., “Microstructure in shear band observed by microfocus X-ray computed tomography”, Géotechnique, vol. 54, 2004, p.539-542.
Otani, J., Mukunoki, T., Obara, Y., “Characterization of failure in sand under triaxial compression using an industrial X-ray scanner”, Int. J. of Physical Modelling in Geotechnics, vol. 1, 2002, p. 15-22.
Pan, B., Qian, K., Xie, H., Asundi, A., “Two-dimensional digital image correlation for inplane displacement and strain measurements: a review”, Meas. Sci. Technol., vol. 20, 2009, doi:10.1088/0957-0233/20/6/062001.
Rechenmacher, A.L. “Grain-scale processes governing shear band initiation and evolution in sands”, J. of the Mech. and Phys. of Solids, vol. 54, 2006, p. 22-45.
Roscoe, K.H., “The influence of strains in soil mechanics”, Géotechnique, vol. 20, 1970, p. 129-170.
Roscoe, K.H., Arthur, J.R.F., James, R.G., “The determination of strains in soils by an x-ray method”, Civ. Eng. Public Works Rev., vol. 58, 1963, p. 873-876 and 1009-1012.
Viggiani, G., Lenoir, N., Bésuelle, P., Di Michiel, M., Marello, S., Desrues, J., Kretzschmer, M., “X-ray micro tomography for studying localized deformation in fine-grained geomaterials under triaxial compression”, Comptes rendus mécanique, vol. 332, 2004, p. 819-826.
Viggiani G., Hall S. A., “Full-field measurements, a new tool for laboratory experimental Geomechanics”, Deformation Characteristics of Geomaterials, IOS Press, Atlanta, USA, 2008, p. 3-26.