
Experimental Investigation of Rate Effects on Two-Phase Flow through Fractured Rocks Using X-ray Computed Tomography
ABSTRACT. Capillarity, gravity and viscous forces control the migration of fluids in geologic formations. However, experimental work addressing the impact of injection flow rate in fractured core samples is limited. Understanding how injection flow rate affects fracture-matrix transfer mechanisms and invasion front evolution in fractured geomaterials are of crucial importance to modeling and prediction of multiphase ground flow. In this study, we monitor and analyze transfer mechanisms in a rock sample with a single tensile horizontal fracture using medical X-ray computed tomography. The impact of different injection rates on the resulting fluid recovery and saturation maps is evaluated through visual and quantitative analyses. Results from this investigation provide a comprehensive set of data for the validation of numerical models and strengthen fundamental understanding of multiphase flow in fractured rocks.
KEYWORDS: fractured rocks, multiphase flow, capillarity, x-ray computed tomography
1. Introduction
Structural characteristics of fractures such as the aperture and orientation affect fluid migration in fractured systems. For instance, Karpyn, et al. (2009) found that bedding planes adjacent to fracture zones with higher aperture tend to have higher porosity, and higher permeability, thus affecting the overall hydraulic conductivity of the system. Firoozabadi and Markeset (1992) studied gravity and capillary cross-flow in fractured porous media, and showed that the contribution of capillary cross-flow from the side faces of the matrix rock increased with the tilt angle. Gu and Yang (2003) used numerical modeling to study the interfacial profile between two immiscible fluids in a reservoir with a fracture with random orientation, and found that the equilibrium shape of the interfacial profile depends on the ratio of gravity and capillary forces.
When a wetting fluid flows through a fracture, capillarity may drive the wetting fluid from the fracture into the matrix, while viscous forces propel the fluid to flow through the fracture with less resistance. Rangel-German, et al. (2006) used stacked Boise sandstone blocks to study multi-phase flow in a fractured system. They concluded that both capillary and viscous forces control the flow in the fracture and that capillary continuity can occur in any direction, depending on the relative strengths of the capillary and Darcy (viscous) terms in the flow equations. These forces dominate fluid migration in fractured formations and strongly influence fracture-matrix transfer mechanisms. In addition, Babadagli (1994) found that as the injection rate is increased, fracture pattern becomes an important parameter controlling the saturation distribution in the rock matrix. As the rate is lowered, however, the system begins to behave like a homogenous system showing a frontal displacement regardless of the fracture configuration. Although these and other studies (Prodanovic, et al. (2008), Hoteit and Firoozabadi (2008), Donato, et al. (2007), and Rangel-German, et al. (2006)) have contributed to current understanding of multiphase flow in fractured systems, there is still limited understanding of the relative impact of variables affecting two-phase displacement mechanisms in fractured rocks. Analyzing how injection rate affects fracture-matrix flow, especially under capillary dominated conditions, remains largely unexplored and it is the main goal of this paper. The present work is one component of a multi-variable, experimental analysis of fracture-matrix flow including the effects of fracture orientation, bedding plane orientation relative to the fractures, flow direction, and fluid type.
A laboratory flow apparatus was designed specifically for this set of experiments, in which saturation maps are monitored as a function of time for two injection flow rates. X-ray computed tomography (CT) was used to record these saturation maps as a function of time. Continuous CT scanning allowed us to track capillary imbibition into a fractured Berea sandstone sample originally saturated with Kerosene. Results from this work help visualize the impact of injection flow rate on the dynamics of fracture-matrix transport and, at the same time, provide detailed quantitative information for the validation of representative numerical models of fractured permeable geomaterials.
2. Experiment design
The purpose of this design was to create a flow system and holder for a two-dimensional fractured sample, to allow complete sample monitoring with single-slice CT scanning. By making the sample a thin disk, we eliminate one flow direction, the one orthogonal to the disk. Therefore, a single slice is sufficient to capture the entire fracture and the surrounding rock matrix, thereby allowing us to keep track of saturation changes at small time intervals. The rock sample used in this study was Berea Sandstone. Each Sample disk has a diameter of 102 mm and thickness of 10 mm. A single tensile fracture was created artificially on each disk. All fractures are aligned with the centre of the sample and perpendicular to the bedding layers. Fracture apertures are around 0.5 mm. Pore volume of the matrix and fracture are 18.51 mL and 0.51 mL respectively.
The experimental apparatus includes three major portions: sample holder, fluid supply system and x-ray CT scanner. A medical HD350 scanner with a detection limit of 25 microns was used in this study. Each CT image produced a matrix of 512 by 512 pixels covering the entire sample. The voxel size was 0.20×0.20×5.00 mm.
A cake-shaped sample holder was fabricated according to the diagram shown in Figure 1. This sample holder is made of Teflon to avoid chemical reaction with fluids, and only Teflon and the rock sample are intercepted by the scanning plane. Viton rubber sheets are used to seal the gap between the sample and the walls of the holder, thus blocking potential pathways around the sample and allowing fluid flow through the fracture alone. The supporting rod, also shown in the top-right insert in Figure 1 can rotate in 45 degree increments, and it is attached in such a way that the cell can rotate on its horizontal axis. Although the core holder is designed to allow different fracture inclinations and flow directions with this rotation system, this paper focuses on experiments using a horizontal fracture.
A schematic representation of fluid circulation system is presented in Figure 2. Water and kerosene represent the wetting and non-wetting fluid phases, respectively. Water was tagged with 15% by weight of sodium iodide (NaI) to increase its CT registration and provide a high contrast between the two phases. A vacuum pump enables the sample holder reach 250 microns vacuum condition. This vacuum state is used to pre-saturate the sample with kerosene. A syringe pump (LC-5000) delivers the tagged water through the fracture. To guarantee a predominantly capillary-driven displacement, injection flow rates are low, in the order of 40 mL/hr and 4 mL/hr, which correspond to capillary numbers in the order of 8.6×10⁻⁶ and 8.6×10⁻⁷, respectively. The capillary number represents the relative control of viscous over capillary forces. For capillary numbers below 10−5, flow in porous media is considered to be dominated by capillary forces.
Figure 1. Schematic drawing of sample holder design
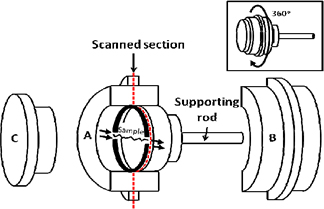
Figure 2. Schematic drawing of fluid circulation system
3. Experimental procedure
A schematic representation of the experimental procedure is presented in Figure 3. The dry fractured sample is packed and vacuumed in the sample holder and scanned to observe its heterogeneity and its layered structure (stage 1 in Figure 3). In stage 2, the sample is saturated with kerosene (non-wetting phase) and scanned. The image difference between these two stages is used for porosity calculations. In stages 3 and 4, the sample was flooded by injecting water. Fluid saturations were continuously monitored by scanning at specific time interval until residual oil saturation was reached. At the same time, kerosene recovery is recorded as a function of time at the outlet.
Figure 3. Experimental procedure and CT scanning sequence
4. Determination of porosity and fluid saturation
The average sample porosity (ϕavg) is 23.27% obtained from the volume of kerosene used in saturating the sample and the bulk volume of the sample. Pixel porosities (ϕpixel) were obtained from equation [1] using x-ray CT registrations from the vacuum condition in stage 1 (CTvacuum) and the kerosene saturated condition in stage 2 (CTwet) as shown in Figure 3.
[1] ![]()
In situ saturations were also determined using data from the CT scanner. Pixel water saturations (Sw,pixel) were obtained from equation [2], where ϕpixel is the pixel porosity from equation [1], Sw,avg is the average saturation of water in the sample obtained from the linear correlation between 100% water saturated and 100% kerosene saturated sample CTwet.
[2] ![]()
5. Results and discussion
Average saturation changes as a function of time and pore volume injected are presented in Figure 4. These saturations were averaged over the entire sample, including fracture and rock matrix. In Figure 4-top, water breakthrough for the low-rate curve in red is delayed 10 min with respect to the higher-rate blue curve. In addition, the higher flow rate curve (q=40 mL/hr) reaches higher water saturation, and thus higher oil recovery, sooner than the low-rate case, but it requires more pore volume injected to reach that saturation level, as seen in Figure 4-bottom. After approximately 300 minutes of water injection, oil recovery becomes negligible in both cases, when water saturation reaches 0.56. Under this final saturation conditions, both oil and water are still mobile inside the rock sample, but the increments in water saturation are too small to be appreciated in the lapse of a few days.
Figure 4. Average water saturation as a function of time
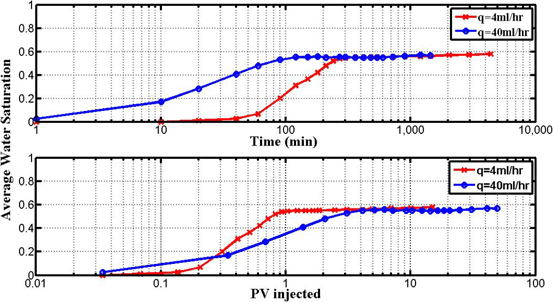
Figure 5 and Figure 6 are time progressions of water saturation (Sw) maps corresponding to high and low water injection rate. Dark blue represents regions saturated with kerosene (Sw=0.0), red represents regions saturated with water (Sw=1.0), and intermediate colors represent the co-existence of kerosene and water. For the high rate case (Figure 5) we see a sharp increase in water saturation in the neighborhood of the fracture. Under this flowing condition, the fractures refills with water at a faster rate than it can be transferred through the fracture-matrix interface, confirming similar experimental observations found in the literature (Rangel-German and Kovscek (2002)). Simultaneously, counter-current imbibition is occurring in the water invaded zone as oil is expelled from the matrix into the fracture. As time progresses, the imbibition front moves away from the fracture, and water accumulation becomes evident around the outlet end of the fracture (right side) in red, supporting the fact that the rate of capillary dispersion through the matrix is low compared to the rate of injection.
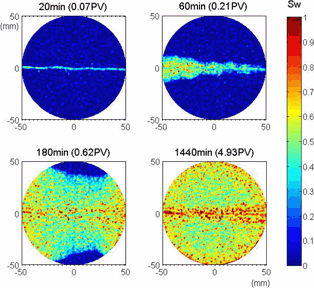
The rate of injection is also responsible for the shape of the imbibing front, which is farther away from the fracture inlet than the outlet. These mechanistic observations are less pronounced when the rate of injection is reducing. Figure 6 shows an analogous progression of water saturation maps obtained at 4 mL/hr of water injection. The contrast in saturation ahead and behind the water front is not as sharp as that in Figure 5. This is evident in a smoother color transition, passing from dark to light blue, to green, and finally yellow and red. In addition, for approximately the same pore volume injected, that is 0.69 PVI at 20 min high-rate and 180 min low-rate, we observe a much larger imbibed region in the low-rate case. This implies low injection rate (4 mL/hr) allows a more effective spreading of water for the same volume injected. Plots in Figure 5 and Figure 6 also show symmetry of the saturation fronts relative to the fracture location indicates gravitational effects are negligible.
Figure 5. Sequence of water saturation maps obtained from CT scanning at 40 mL/hr water injection rate
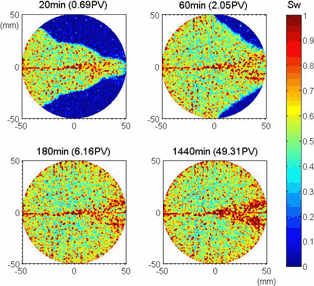
Figure 6. Sequence of water saturation maps obtained from CT scanning at 4 mL/hr water injection rate
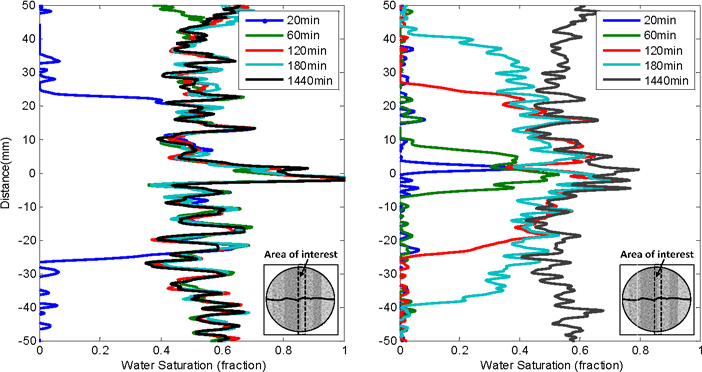
Further quantitative examination of saturation changes obtained from CT scanning is presented in Figure 7. These vertical saturation profiles averaged over the central 6 mm of each CT slice for the two flow rates under study. These profiles capture saturation changes with time in the direction perpendicular to the fracture. For both experiments, continuous high water saturation is observed in the center of the sample, where the fracture is located. The most salient differences between these two groups of vertical profiles are: (1) the speed at which the water front moves away from the fracture, which was also evident in the saturation maps presented in Figures 5 and 6; and (2) the change in saturation as we move away from the fracture. Figure 7-right shows a gradual saturation change at the front, while there is a drastic drop in saturation across the water front in Figure 7-left. Furthermore, water saturations remain in the 0.50-to-0.55 range within the imbibed zone, which suggests that both fluid phases are under a dynamic equilibrium at that saturation. This is consistent with the knowledge that counter-current flow is the prevalent flow mechanism in the imbibed zone. As the water front progresses, the resident oil is displaced towards the fracture, in a counter-current manner, and replenished by the oil that is sitting ahead of the front, thus maintaining a dynamic equilibrium and a constant saturation in the imbibed zone.
Figure 7. Vertical saturation profiles perpendicular to the fracture and averaged over the central 6 mm of the sample, q=40mL/hr (left) and q=4mL/hr (right) (see CD for color version)
6. Conclusions
In this experimental study, we analyze the impact of two different injection rates on the capillary dominated displacement of oil by water in a fractured rock sample, using x-ray computed tomography. The higher injection flow rate (q=40 mL/hr) showed higher oil recovery, although more pore volume was needed to reach the ultimate oil recovery. A sharp imbibing front was observed in the high-rate experiment, while a smoother saturation gradient was observed at low rate. Water saturation in the imbibed zone remains constant at around 0.50-to-0.55, suggesting a dynamic equilibrium in the mobility of oil and water phases. We also describe the counter-current flow mechanisms that are evident from the experimental results, and support our observations on the evolution of saturation maps and profiles obtained in the laboratory. These experiments will be extended in upcoming studies to cover a broader range of flowing conditions and fracture orientations, and served as reference data to test the validity of traditional fracture-matrix transfer function.
7. Acknowledgements
The National Science Foundation, project CMMI-0747585, and the Penn State Center for Quantitative Imaging.
8. References
Babadagli T., “Injection rate controlled capillary imbibition transfer in fractured systems”, SPE 28640, Proceedings of the SPE Annual Technical Conference and Exhibition, New Orleans, LA, USA, 25-28 September 1994.
Donato G., Lu H. Y., Tavassoli Z., Blunt M. J., “Multirate-transfer dual-porosity modeling of gravity drainage and imbibition”, SPE Journal, vol. 12 no. 1, 2007, p. 77-88.
Firoozabadi A., Markeset T., “An experimental study of capillary and gravity cross-flow fractured porous media”, SPE 24918, Proceedings of the SPE Annual Technical Conference and Exhibition, Washington, DC, 4-7 October 1992.
Gu Y. G., Yang C. D., “The effects of capillary force and gravity on the interfacial profile in a reservoir fracture or pore”, Journal of Petroleum Science and Engineering, vol. 40 no. 1-2, 2003, p. 77-87.
Hoteit H., Firoozabadi A., “An efficient numerical model for incompressible two-phase flow in fractured media”, Advances in Water Resources, vol. 31 no. 6, 2008, p. 891-905.
Karpyn Z. T., Alajmi A., Radaelli F., Halleck P. M., Grader A. S., “X-ray CT and hydraulic evidence for a relationship between fracture conductivity and adjacent matrix porosity”, Engineering Geology, vol. 103 no. 3-4, 2009, p. 139-145.
Prodanovic M., Bryant S. L., Karpyn Z. T., “Investigating matrix-fracture transfer via a level set method for drainage and imbibition”, SPE 116110, Proceedings of the SPE Annual Technical Conference and Exhibition, Denver, Colorado, 21-24 September 2008.
Rangel-German E., Akin S., Castanier L., “Multiphase-flow properties of fractured porous media”, Journal of Petroleum Science and Engineering, vol. 51 no. 3-4, 2006, p. 197-213.
Rangel-German E. R., Kovscek A. R., “Experimental and analytical study of multidimensional imbibition in fractured porous media”, Journal of Petroleum Science and Engineering, vol. 36 no. 1-2, 2002, p. 45-60.