
Characterization of Soil Erosion due to Infiltration into Capping Layers in Landfill
Use of industrial x-ray CT scanner for visualizing soil erosion
ABSTRACT. The chemical stabilization of burned ash would be retarded by the local infiltration due to soil erosion and partial variability of density in the capping layer. In order to improve the local infiltration in the final cover-treatment soil, it is important to understand the generation of local preferential flow paths due to rainfall in the cover soil. In this paper, x-ray Computed Tomography (CT) images were used to analyze the density change of the model cover soil after watering test with several test conditions.
KEYWORDS: landfill, soil erosion, unsaturated soil, x-ray CT scanner, cover-soil system
1. Introduction
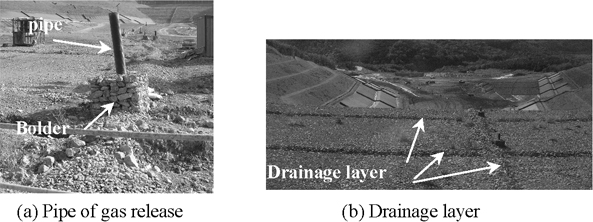
The long-term infiltration of rainfall into a landfill can cause two potential issues: dilution of leachate concentration and, erosion of fine grains in the final cover-treatment soil. The first factor called Washing Out Effect, would bring the contribution of early chemical stabilization of a burned ash (Higuchi 2005 and McDougall et al. 2001). Meanwhile, the second factor would cause negative issues due to increased preferential flow path. Preferential flow path is locally generated in the final cover-treatment soil and waste (Koener and Daniel, 1997 and Ishibashi et al. 2008). Local generation of preferential flow path would make the flow rate increase in the cover soil; and then, the harmlessness process of the waste promotes heterogenous stabilization in the landfill. Hence, it is significant to reduce the generation of preferential flow path in the final cover-treatment soil. Authors have focused that the factor of generating local-preferential flow path would be caused by heterogeneity of density in the cover soil (Mukunoki et al. 2008). Figure 1 presents photographs of gas release pipe and drainage layer around the leachate collection pipe in a landfill. Both of these are designed to create high hydraulic conductivity paths; hence, the gravels and bolder were installed as shown in Figures 1(a) and (b). In order to collect methane gas and leachate in the landfill, the drainage layer was large voids and they would become enough space for movement of soil particles.
The objective of this study is to observe the condition of soil erosion in the final cover-treatment soil and to understand the mechanism of generating preferential flow paths. This paper will discuss the result of model tests using decomposed granite soil with different density condition and particle size as a final cover-treatment soil using x-ray Computed Tomography (CT) images.
Figure 1. Photograph of gas release part and drainage layer in a landfill
2. Experimental overview
2.1. Development of test apparatus
Figure 2 shows an entire system of sprinkling test apparatus. Figure 3 is a picture of the surface of model soil tested. The model ground was 200 mm in depth and 200 mm in diameter. Gravels in the center of the model soil were placed at 150 mm depth from the surface of model soil and 50 mm in diameter. The gravel has a mean diameter (D50) of 20 mm. The gravel part models the drainage layer for gas collection layer. During the rainfall test, water migrated through the model ground and drained from the bottom part of the soil box. Authors developed the system of water circulation. The capacity of water tank is 400 L. The soil box was placed in the large box to capture the drained water, which was the pumped back to the water. This system can use the water of 400 L repeatedly.
Figure 2. Entire system of test apparatus
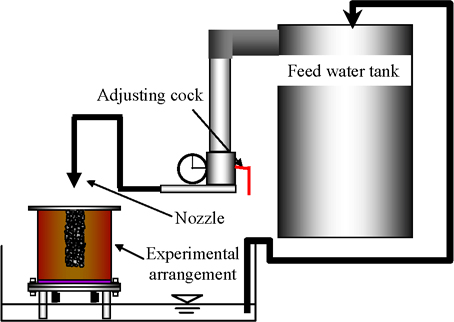
Figure 3. Photograph of the surface on the model ground
2.2. Test condition
Figure 4 illustrates the cross-sectional view of model ground. In this study, we are interested the density changes from soil erosion due to rainfall near the gas collection layer. Hence, the gravels were installed at the center of the model ground as Case 1 (Figure 3). The mean diameter (D50) of soil used was 0.85 mm and the uniformity coefficient was 22.4.
Figure 4. The cross-sectional view of the model ground for Case 1 and Case 2
In Case 1, the bulk dry density was 1.5 t/m3 and the initial saturation degree was 58%. Meanwhile for Case 2, two different density conditions were established around the gravels. In Case 2, the two different bulk dry densities prepared were 1.4 t/m3, and 1.7 t/m3. The initial saturation of model ground with the density of 1.4 t/m3 was 58% and with 1.7 t/m3 was 91%. The reason why the initial saturation degree was not 100% was because the model test was performed on the outside of the CT room so the model ground had to move to the CT room. During this process, there was a concern that water leaked from the bottom part of the model ground. The extra mass loss of pore water in the model ground does not allow us to quantitatively evaluate density change due to movement of soil particle because of the change of wet density. Therefore, authors confirmed the residual saturation degree of the model soil after the test and its saturation degree was given as the initial saturation degree.
3. Results and discussion
3.1. Calibration of CT-value, density and hydraulic conductivity
In general, CT-value is proportional to density so that the correlation between CT-value and hydraulic conductivity could be obtained based on the hydraulic conductivity tests. Figure 5 shows the correlation of CT-value, dry density and hydraulic conductivity of decomposed granite soil tested for each density condition. The solid line and equations showed linear approximation by air (0.0 t/m3, CT-value: −997), water (1.0 t/m3, CT-value: 9) and variant density of model grounds (1.4 t/m3, CT-value: 640 or 1.5 t/m3, CT-value: 663 or 1.7 t/m3, CT-value: 745). Density and hydraulic conductivity of model soil were deduced from each CT-value with Figure 4.
3.2. X-ray CT image of Case 1 (1.5 t/m3)
Figure 6 shows the cross-sectional CT image of the model ground for Case 1 before and after the sprinkling test. After the sprinkling test, soil erosion around gravels can be observed in images at 150 mm height within the white line. The soil erosion progresses due to sprinkling at upper grounds. The white dot line points out the low density area in dry such as 0.36 t/m3 and 0.74 t/m3.
Figure 5. The correlation of CT-value between CT-value – dry density and hydraulic conductivity
Figure 6. X-ray CT images for Case 1 before and after the sprinkling test
Figure 7. Contour map of hydraulic conductivity in the model ground for Case 1
It can be observed that soil particles were moved into the large pores in the gravel layer. The soil erosion would be generated in a continuous flow and presented model ground to make a complicated structure.
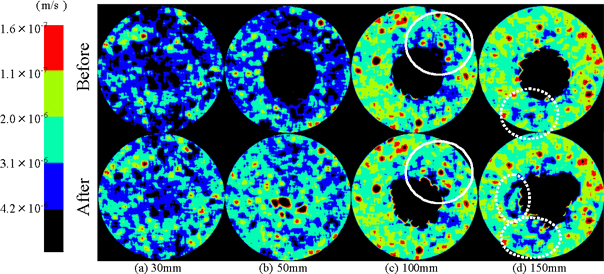
Figure 7 shows the color contour map of saturated hydraulic conductivity deduced from the CT-value (Figure 6) and the relations shown in Figure 5. The black area in Figure 7 indicates that the hydraulic conductivity in each contour map is the greatest area in the gravel part. After sprinkling test, the area of hydraulic conductivity between 3.10 × 10⁻⁶ m/s and 1.60 × 10⁻⁷ m/s increases from 7% to 9% at 30 mm and 50 mm height from the bottom of soil box. The migration of soil particles would make progress with soil erosion, so the soil particles were washed away with seepage flow. On the other hand, the hydraulic conductivity dropped down in white dot-line at 100 mm height. That means the soil particles were drastically washed away from 150 mm high and were clogged in 100 mm height. In contrast, the permeable area would be risen up in white dot line at 150 mm.
3.3. X-ray CT image of Case 2 (1.4 t/m3 and 1.7 t/m3)
Figure 8 shows the cross-sectional image of the model soil for Case 2 before and after the sprinkling test. The white dot line is boundary line between density of 1.4 t/m3 and 1.7 t/m3 in this figure. After the sprinkling test, the area with 1.7 t/m3 density was eroded as shown in Figure 8. By contrast, the area of 1.4 t/m3 has a higher porosity than the area of 1.7 t/m3 so it should be more permeable. Then, it was observed that the eroded area was formed with migration of soil particles around gravels at 100 mm and 150 mm.
Figure 9 shows the distribution of hydraulic conductivity deduced from the CT-value (Figure 8) and the relations shown in Figure 5. In the area of 1.4 t/m3, the hydraulic conductivity increased at each height. So it was considered that migration of soil particles were generated with weak interaction between soil particles.
Figure 8. X-ray CT images for Case 2 before and after the sprinkling test
Figure 9. Contour map of hydraulic conductivity in the model ground for Case 2
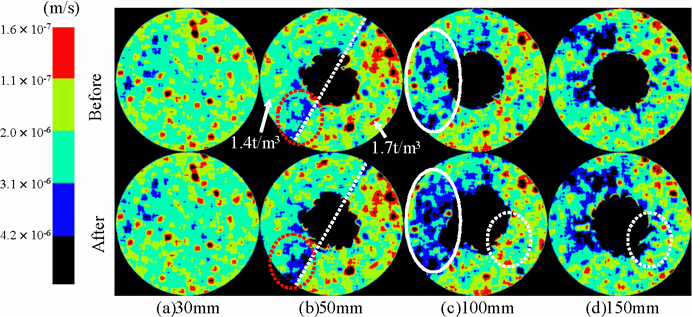
After the sprinkling test, the area with a conductivity of 4.2 × 10⁻⁶ m/s was widely distributed. The dot line in white shows soil erosion in the area of 1.7 t/m3. It cannot be observed that local water permeability area at 1.7 t/m3 was generated. Then, boundary area between 1.4 t/m3 and 1.7 t/m3 was soil erosion area.
3.4. Factor of generating local preferential flow path in the cover soil
The factors leading to the generation of preferential flow paths in the cover soil were 1) the density change of soil layer, 2) different particle size and 3) loss of the matrix suction due to increase in the saturation degree in the soil. Fine grain soil eroded first with water seepage and, in addition, the case that there is enough space where coarse grains also could move would cause the final preferential flow path. Simultaneously, the increase of water saturation brought a reduction in the matrix suction between soil particles. As the results have shown, the local-preferential flow path created near the part with the density change and different particle size. In order to have more quantitative discussion, the numerical analysis of unsaturated flow concerned about the boundary condition of cover soil is ongoing.
4. Conclusions
The sprinkling test was performed and the inner condition of model soils at each level was scanned by x-ray CT scanner. Preferential flow path could be visualized for each case and the causes were discussed in this paper. The major conclusions of this study are as follows:
– x-ray CT scanner is effective application to determine distribution of density and hydraulic conductivity in soils;
– large voids in the drainage layer were clogged due to soil erosion, and;
– factor causing soil erosion would be density change of soil layer, difference of particle size and the lost of the matrix suction in the soil.
5. References
Higuchi, S. 2005. “Early stabilization for the landfill”, Proc. of 17th Annual Conference of The Japan Society of Waste Management Experts, JSWME:959 (in Japanese).
Ishibashi, T., Komiya, T., Nakayama, H. and Shimaoka, T. 2008. “Restraint of Rainwater Infiltration within a Landfill Site Capping Layer Using Geosynthetics for Drainage”, Journal of the Japan Society of Waste Management Experts, Vol. 19(2), 101-108 (in Japanese).
Koerner, R. and Daniel, D. 1997. “Final covers for solid waste landfills and abandoned dumps”, American Society of Civil Engineering, Press, Reston, VA, USA.
McDougall, F., White, P., Frank, M. and Hindle P. 2001. Integrated Solid Waste Management: Life Cycle Inventory, Blackwell Publishing Ltd, Oxford.
Mukunoki, T., Taniguchi, N., Matsumoto, H. & Murakami, Y. 2008. “Visualization of soil erosion under a geotextile due to infiltration using X-ray CT”, Procs. of the fourth European Geosynthetics Conference, Euro Geo2008, CD-R.