
Latest Developments in 3D Analysis of Geomaterials by Morpho+
ABSTRACT. At the Center for X-ray Tomography at Ghent University (Belgium) (www.ugct.ugent.be), besides hardware development for high-resolution x-ray CT scanners, a lot of progress is being made in the field of 3D analysis of the scanned samples. Morpho+ is a flexible 3D analysis software which provides the necessary petrophysical parameters of the scanned samples in 3D. Although Morpho+ was originally designed to provide any kind of 3D parameter, it contains some specific features especially designed for the analysis of geomaterial properties like porosity, partial porosity, pore-size distribution, grain size, grain orientation and surface determination. Additionally, the results of the 3D analysis can be visualized which enables us to understand and interpret the analysis results in a straightforward way. The complementarities between high-quality x-ray CT images and flexible 3D software are opening up new gateways in the study of geomaterials.
KEYWORDS: 3D analysis, x-ray CT, geomaterials, Morpho+, high-resolution
1. Introduction
At the Center for X-ray Tomography at Ghent University in Belgium (UGCT, www.ugct.ugent.be) there is a continuous drive to perform x-ray tomography scans at the highest quality and highest resolution with laboratory equipment. The combination of x-ray CT and 3D visualization is a powerful technique which allows us to look inside the samples in a non-destructive way. Although 3D visualization is a powerful tool to investigate the sample after reconstruction, it has its limitations. While large and apparent structures can be rendered and their shapes and relative sizes can be assessed qualitatively, a lot of information remains hidden. To extract quantitative information, the volume has to be analyzed using appropriate computer algorithms. Since a complete volume of linear attenuation coefficients can be obtained from x-ray computed tomography, the possibilities to analyze the resulting data are extensive. While a single cross-section can already reveal a lot of useful information, the true power of x-ray tomography lies within the capability to extract quantitative information about internal and external three-dimensional structures. Therefore Morpho+, a flexible 3D analysis software package, was developed in-house, in order to provide any kind of 3D parameter for any kind of scanned material.
2. Morpho+
Morpho+ is a new software package developed at the UGCT (Belgium) which provides 3D data of CT scans like porosity, pore-size distribution, grain orientation, sphericity, etc. The development of Morpho+ was initiated by the observation that the in-house developed Matlab analysis package μCTanalySIS (Cnudde et al., 2004) showed several shortcomings like the lacking of user interface and advanced level of functionality. Although Morpho+ builds on some of the concepts used in μCTanalySIS, it combines this with more performance, a more extensive set of analysis tools and an interactive and intuitive user interface. Due to the versatility of the applications at the UGCT, full control over the analysis process and a thorough understanding of the underlying algorithms was an essential requirement for this software. Additionally, the possibility to implement custom algorithms for specific applications was a prerequisite. These conditions had to be combined with a high computational performance and memory efficient code. In order to obtain the necessary user-friendly interface, performance and coding flexibility, Morpho+ was programmed in C++ using the Qt® application framework.
The typical work-flow for the 3D analysis in Morpho+ will be illustrated on the dataset of a North Sea reservoir sandstone. This sandstone was scanned with the flexible micro CT set-up from UGCT. After scanning and reconstruction of the images, the different steps possible in Morpho+ in order to obtain 3D data are described.
2.1. Scanning conditions
The North Sea reservoir sandstone sample was scanned with the flexible micro CT scanner of UGCT. The transmission head (Feinfocus, FXE-160.51) was selected with a tube voltage of 110 kV and a tube current of 73 µA. The Varian PaxScan 2520V (1880 × 1496 pixels) was used as the detector. 1,200 projections were taken over 360°, with an exposure time of 300 ms per frame and 5 frame averages were taken per projection. This resulted in a total scan time of around 1 hour. The highest spatial resolution of this system, depending on the sample size, the spot size of the x-ray source and the resolution of the detector, is around 1 µm. For this set-up, with a geometrical magnification of 23, a resolution of 3.97 µm was obtained in all directions. After reconstruction of the projections with the software package Octopus (Vlassenbroeck et al., 2007), a series of horizontal cross-sections (Figure 1) was obtained, ready to be analyzed.
Figure 1. Reconstructed cross-section through a North Sea reservoir sandstone
2.2. 3D analysis by Morpho+
2D reconstructed images all contain information which is shown in a grayscale representation. This gray sale is used for further 3D analysis in Morpho+. However, a grayscale volume is only a discrete representation of a real object. This poses several limitations, like the fact that features smaller than the voxel size cannot be distinguished. Although only cross-sections of the analyzed volume are shown in the following paragraphs, all analysis steps in Morpho+ are performed in 3D.
2.2.1. Morpho+ analysis steps
2.2.1.1. Volume of interest selection
When performing 3D analysis, first the volume of interest (VOI) needs to be selected in order to omit irrelevant data which can give wrong analysis results. For example, when analyzing the porosity distribution in a geological sample, the air outside the sample should not be included in the analysis. For cylindrical or cuboid samples, a VOI can be selected by defining a circular or rectangular region in one cross-section and by propagating this selection over a number of cross-sections in the stack. Additionally, Morpho+ allows rotating a cylindrical or cuboid VOI to compensate for sample tilt. Irregular shaped samples need a more intelligent approach for the selection of a VOI. In Morpho+ this is possible by using segmentation and binary operations in order to select the correct VOI.
2.2.1.2. Segmentation and filtering techniques
Segmentation algorithms are aimed at extracting structural features from the volume, like the pore network or the grains inside the sandstone. To facilitate the segmentation several noise filters (median, Gaussian and bilateral filter) are available in Morpho+, where each filter has its own unique properties in terms of noise reduction and preservation of image sharpness. The median filter is a non-linear filter, where each voxel value is replaced by the median of its neighboring voxels. This filter can reduce the spread and overlap of the distributions of the gray values of the different components inside an image, which makes it easier to segment the different components since it preserves straight edges, although sharp corners are rounded. The Gaussian filter is a linear filter, since each voxel of the volume is replaced by a linear combination of voxels within a kernel of size N × N × N centered around the voxel. This filter results however in a blurring effect around edges. The bilateral filter is an extension of the Gaussian filter, where the actual grayvalues of the neighboring voxels are taken into account. When a material voxel close to an edge is evaluated in the Gaussian filter, the neighboring voxels containing the same material are processed in the same way as the voxels corresponding to air. The bilateral filter (Tomasi & Manduchi, 1998) solves this problem by adapting the multiplication factors of the filter kernel based on the actual grayvalues of the neighboring voxels.
After the filtering operations, the data is thresholded to separate the material of interest from the background. During this operation a binary volume is created and voxels are categorized as foreground voxels, when their grayscale value lies within a certain interval, and as background voxels, when they are outside of the interval. The threshold level can be calculated automatically in Morpho+ by using Otsu’s method which assumes the volume is composed of two components, where each component shows a certain distribution of grayvalues in the histogram, and both distributions have an overlapping region (Otsu, 1979). When applied to real data, Otsu’s method and other automatic thresholding techniques often fail, especially when the partial volume effect (the grayvalue of a voxel corresponds to the average linear attenuation coefficient of the different materials inside the voxel) play a significant role. Besides automatic thresholding several classes of manual thresholding techniques exist in Morpho+ like single thresholding, which is sensitive to residual image noise, and dual thresholding, which uses two separate threshold values (or intervals) to reduce the sensitivity to residual image noise. In the scanned sandstone, besides the dense inclusions, the grains or the pore structure can easily be segmented by using the dual thresholding technique.
Several binary operations, including opening, closing, removal of isolated foreground/background voxels and the filling of holes are implemented in Morpho+ which can help to remove or reduce the still remaining noise after thresholding. For our sample this was not necessary however.
2.2.1.3. Labeling
The next step in the analysis process is the labeling. The binary volume is therefore divided into several connected components called objects, where each object is assigned a unique value (color code). This object labeling is used to detect each connected component of foreground voxels in the binary image and to assign a unique label to all voxels of that object. In Morpho+, a series of algorithms is used to detect the connected components (Roselfeld & Pfaltz, 1966; Knuth, 1997). The labeling algorithm results in a 3D array of integer labels and a list of objects is extracted from this array. Each object can then be analyzed separately, which adds a significant flexibility to the analysis process. Each object is characterized by its bounding box, the position of its bounding box in the original volume and the object voxels inside the bounding box. After the extraction of the list of objects, several operations are possible. Before proceeding with other analysis steps, it is often interesting to apply the fill holes algorithm to the individual objects.
2.2.1.4. Distance transform
After the labeling algorithm, the Euclidean distance transform (Guan & Ma, 1998; Delerue, 2001) is applied which serves several purposes in Morpho+. It can be used to separate objects which are initially connected, combined with the watershed segmentation, based on the algorithm by Vincent et al. (1991). Also, the maximum opening of an object, defined as the diameter of the maximum inscribed sphere which fits inside the object, can be extracted from its distance transform.
2.2.1.5. Quantitative information
After obtaining the distance transform, several parameters can be determined quantitatively in Morpho+. The total porosity can be obtained by dividing the total number of foreground voxels by the total number of voxels in the VOI. For the total analyzed volume of the scanned sandstone a total porosity of 13% was found. Since the total volume can be subdivided in several blocks in any direction (X, Y or Z) it is possible to evaluate the porosity per block. This way the porosity distribution in the sample can be extracted. The determination of the percentage of open and closed pores can also be distinguished. The open porosity is defined as the porosity of all border objects, while the closed porosity is composed of the isolated objects. Additionally, it is possible to extract information from each object. This data can be exported for each object and/or distributions can be extracted. The maximum opening and the total volume of each object can be determined. If we construct an equivalent sphere with the same total volume, the corresponding diameter is defined as the equivalent diameter. Based on the maximum opening and equivalent diameter, the sphericity S is defined as the ratio of both. This parameter gives a rough approximation of the shape of objects, since it expresses how much an object resembles a sphere (S = 1). Since Morpho+ can determine the orientation of the objects of interest, such as the grains inside the sandstone, it is possible to plot a stereoplot derived from the 3D analysis of the grains. Additionally, the Euler number, which expresses the multi connectivity of a volume and can be used to compare the connectivity of different (similar) samples, and the fractal dimension, determining how efficiently an object fills the space under consideration, as well as surface extraction, the determination of connections, and skeletonization are also implemented in Morpho+ (Brabant, 2009).
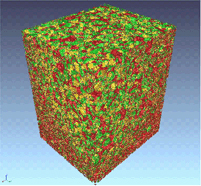
In the sandstone sample the Euler number of the pore network was -68929. A single value of the Euler number is difficult to interpret and these values are more relevant when comparing very similar rocks. Morpho+ also makes it possible to count the number of objects that are not connected to each other, so in this case the number of isolated pore networks could be obtained. In the analyzed sandstone sample 61,038 isolated pore networks were identified. It is possible to calculate the number of tunnels through the pore network. There were 140,510 tunnels identified through the pore network of the analyzed sample, which illustrates that it has a high multi-connectedness. The fractal dimension of the grains of the sandstone sample is 2.769. The surface of the separate objects or the complete volume can also be extracted by applying the marching cubes algorithm. The resulting 3D mesh can be saved as an STL file and can be used in other software packages for visualization and analysis purposes (for example, finite element simulations). The result is shown for the grains of the sandstone sample (Figure 2).
It is also possible to calculate the surface based on the marching cube algorithm. The pore network within a volume of height 3.08 mm, depth 2.01 mm and width 2.33 mm has a surface of 369 mm2 for the scanned sample.
Figure 2. The visualization of grains of a sandstone sample. The outside of the grains is colored in red, the inside in green and the dividing planes are colored in yellow (see CD of this volume for color version)
2.3. Data visualization
The processed volume can be visualized after each step in the analysis process. Since all analysis algorithms operate in three dimensions, cross-sections of the volume according to the different principal planes can be visualized. Each object can be relabeled (color coded) based on a certain parameter (Figure 3), like for example the equivalent diameter where the blue objects have a small equivalent diameter and the red objects are the largest.
Figure 3. 3D renderings of the color-labeled images after 3D analysis with Morpho+ (see CD of this volume for color version)
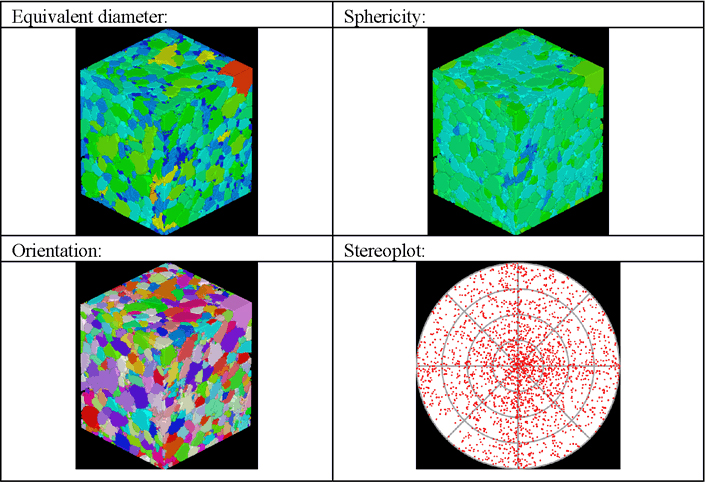
Figure 3 illustrates the different possibilities to process the object data: it shows the distribution of the equivalent diameter, sphericity, the orientation and the stereoplot of the analyzed quartz grains inside the sandstone.
3. Conclusions
Morpho+ contains some specific features especially designed for the analysis of geomaterial properties like porosity, partial porosity, pore-size distribution, grain size, grain orientation, sphericity, orientation, Euler number, fractal dimension and surface determination. Additionally, the results of the 3D analysis can be visualized which enables to understand and interpret the analysis results in a straightforward way. The complementarities between high-quality x-ray CT images and flexible 3D software are opening up new gateways in the study of geomaterials.
4. Acknowledgements
The Fund for Scientific Research—Flanders (FWO) is gratefully acknowledged for the post-doc grant to V. Cnudde. The Institute for the Promotion of Innovation by Science and Technology in Flanders, Belgium is acknowledged for the PhD grant of J. Dewanckele.
5. References
Cnudde, V., Cnudde, J.P., Dupuis, C., Jacobs, P. “X-ray micro-CT used for the localization of water repellents and consolidants inside natural building stones”, Materials Characterization, vol. 53 no. 2-4, 2004, p. 259 – 271.
Tomasi, C., Manduchi, R., “Bilateral Filtering for Gray and Color Images. Computer Vision”, IEEE International Conference, 0:839, 1998.
Otsu, N. “A threshold selection method from gray-level histograms”. IEEE Transactions on Systems, Man and Cybernetics, vol. 9 no. 1, 1979, p. 62–66.
Rosenfeld, A., Pfaltz, J.L. “Sequential Operations in Digital Picture Processing”, J. ACM, vol. 13 no. 4, p. 471–494, 1966.
Knuth, D.E. Art of Computer Programming, Volume 1: Fundamental Algorithms (3rd Edition). Addison-Wesley Professional, July 1997.
Guan, W., Ma, S. “A List-Processing Approach to Compute Voronoi Diagrams and the Euclidean Distance Transform”, IEEE Transactions on Pattern Analysis and Machine Intelligence, vol. 20 no. 7, 1998, 757–761.
Delerue, J.F. Segmentation 3D, application l’extraction de réseaux de pores et la caractérisation hydrodynamique des sols, PhD thesis, Paris XI Orsay, 2001.
Vincent, L., Soille, P. “Watersheds in digital spaces: an efficient algorithm based on immersion simulations”, IEEE Transactions on Pattern Analysis and Machine Intelligence, vol. 13 no. 6, 1991, p. 583–598.
Brabant, L. Geavanceerde algoritmes voor 3D-analyse van micro-CT data, Master’s thesis, Ghent University, Belgium, 2009.
Vlassenbroeck, J., Dierick, M., Masschaele, B., Cnudde, V., Van Hoorebeke, L., Jacobs, P. “Software tools for quantification of X-ray microtomography at the UGCT”, Nuclear Instruments and Methods in Physics Research Section A: Accelerators, Spectrometers, Detectors and Associated Equipment, 2007, 580(1):442-445.