
Neutron Imaging Methods in Geoscience
ABSTRACT. Neutron imaging is a younger and also less known method than X-ray imaging. Through the different attenuation behavior compared to X-rays this method provides complementary information and may even provide another way to investigate a sample non-destructively. The reasons are due to other contrast relations between different materials and isotopes or that the X-rays are unable to penetrate the sample. The basic principles behind neutron radiography and tomography are explained. Also the main components of a neutron imaging system are described. The two neutron imaging beamlines at Paul Scherrer Institute, Switzerland, are presented to show the infrastructure and instrument palette that can be found at a state of the art neutron imaging beamline. An outlook is given to show future instrument developments like energy selective imaging and phase contrast enhancement. Finally, a collection of examples illustrates applications from soil physics, nuclear waste deposit planning, and mineralized fossils.
KEYWORDS: Neutron imaging, tomography, minerals, soil, fluid movements, complementarity
1. Introduction
Using neutrons for imaging purposes has with the development of advanced detector methods proven to be a successful method of investigation for a wide variety of applications in different fields of research. This imaging method is based on the attenuation of an incident beam similar to X-ray imaging. The difference lies in the attenuation mechanism which provides a completely different set of attenuation coefficients compared to X-rays and the quite different neutron and X-ray source characteristics. Water and its movements is an important actor in many neutron imaging investigations because of its high contrast compared to the medium it wets. Water is however not the only high contrast fluid, oil, for example, also delivers high contrast because of its hydrogen content.
Initial neutron imaging experiments at Paul Scherrer Institute (PSI), Switzerland, were made with films [PLE 95]. Film based imaging is inconvenient since the films have to be developed and later the processing and evaluation of the images is difficult. With the development of digital camera systems it is possible to acquire images with both higher temporal and spatial resolution. This allows real-time investigations of infiltration processes [CAR 07]. Further advantages of digital cameras are linear dynamic range and stationary detector. These features make the acquisition of tomographic data sets and referenced time series possible.
In this paper we will describe the principles of neutron imaging and its applications in geology and soil sciences.
2. Method
2.1. Image forming process
Neutron transmission images can be analyzed using the exponential law of radiation attenuation, also known as Beer-Lamberts law. This means that any sample will attenuate the intensity of the illuminating beam (I0) according the material distribution (Σ(x)) along the penetration path (L) through the sample. This can be formulated as the following generalized formulation
[1] ![]()
This is the same attenuation law that applies for X-ray attenuation. The difference is that the linear X-ray attenuation coefficient is replaced by the macroscopic cross section (Σ) of the investigated material. The attenuation mechanism for neutrons is based on the interaction between the neutron and the nuclei of the atoms. The macroscopic cross section is determined by the neutron and proton configuration in the atomic nucleus [KRA 88]. The type of neutron reaction for many isotopes in the thermal and cold energy region is rather scattering than absorption, see e.g. the list of thermal neutron cross sections given by [SEA 92]. As a result Σ is not proportional to the atomic mass as for X-rays which interact with the electrons. Σ can even vary strongly between two isotopes of the same element, e.g. 1H and 2H (Deuterium). For example, the attenuation of hydrogen is an order of magnitude larger than for lead and many other metals. The practical effect of this fact is that the large cross section of hydrogen gives a high contrast for water relative to many porous media in nature. This makes neutrons the optimal probe for the study of wetting of porous media as will be shown later in the applications section.
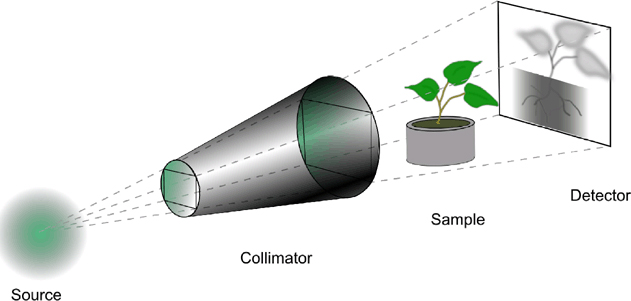
Neutrons are neutral particles and as such they are not able to excite atoms. This mean that they have to be detected by a secondary process that generates charged particles which in turn excite a fluorescent material to emit visible light. A review of different neutron scintillation material is found in [EIJ 04]. At PSI mainly two scintillator materials are used; 6LiF/ZnS(Ag) and Gd2O2S. The Li based scintillator produces more light which shortens the scan times. The Gd based scintillator on the other hand captures more neutrons which allows thinner layers and higher resolution. In an imaging system this scintillation process takes place on a screen that gives the spatial distribution of the neutron intensity behind the sample. The light produced by the scintillator is mostly acquired by cooled CCD cameras. The produced images represent the shadow or projection of the sample. Figure (1) schematically shows the components of a neutron imaging beamline. They are a neutron source, a collimator to shape the beam, a sample table, and finally a detector camera combination to acquire the projection of the sample.
Figure 1: A schematic illustration of a neutron imaging beamline. Important components are a source, a collimator, the sample, and finally a detector combined with a camera.
2.2. Neutron sources
The practical use of neutron imaging for the investigation of geological samples, where tomography is preferred, requires reasonably performance in beam intensity and collimation. A lower limit in beam intensity can be set to 105 neutrons cm−2s−1. Such relatively high neutron fluxes can only be provided by two kinds of sources: nuclear reactors or spallation sources. World-wide, fission research-reactors are more common than the spallation sources. The first one is based on the principle of nuclear fission with U-235 as fissile material. Similarly to nuclear power plants, the chain reaction in fission enables the permanent supply with neutrons. A moderator surrounds the reactor core to moderate the neutron to thermal energies. More recently, spallation was found useful for neutron production. This process is based on the bombardment of high energy particles (in the order of GeV) like protons onto a target of a heavy element, e.g. lead. In the spallation act, the lead nuclei are split into parts of lower mass and 10 to 15 neutrons are emitted per proton. Therefore, a spallation source consists of the strong particle accelerator and the target station as the primary neutron source. PSI operates world’s strongest spallation source (SINQ) for the moment with 590 MeV protons of a beam with about 1.4 mA, corresponding to about 1 MW thermal power [FIS 97]. Its performance compares to a reactor of about 10 MW. In both type of sources neutrons are then slowed down to thermal (25 meV) or cold energies (several meV) in a neutron moderator system containing heavy water or liquid D2 at e.g. 25 K. The beam line layout is very advanced in respect to the extraction principle and used components (mirrored guides, cold source, etc.).
2.3. Neutron imaging beamlines
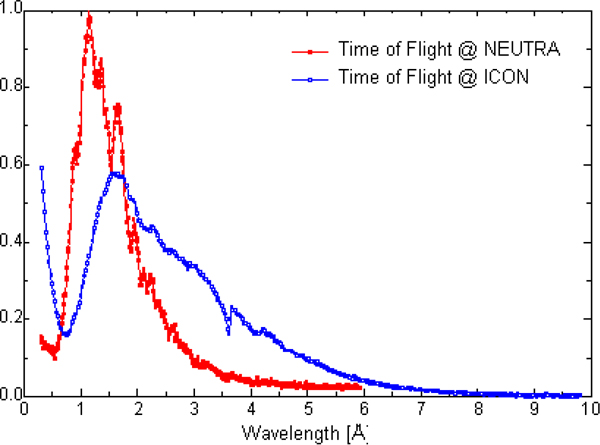
The configuration and characteristics of neutron imaging beamlines varies from place to place. The reason is that each beamline is optimized for the local conditions of the neutron source. Some of these conditions are the neutron spectrum, distance to the source, beam shape, and space in the experimental area. Here, we describe the two neutron imaging beamlines at PSI; NEUTRA and ICON. NEUTRA is the older beamline at PSI and has been operational since 1998. ICON was taken into operation in 2005, figure (2). They have similar infrastructure in terms of sample positioning and camera systems. The major difference is that NEUTRA is attached to a thermal neutron source whereas ICON is attached to a cold neutron source which operates at 25 K. The spectra of NEUTRA and ICON are plotted in figure (3). The macroscopic cross section for materials is larger for cold neutrons for many isotopes. In general the neutron caption reactions are related to the inverse of the neutron velocity. For cold energies the effect of scattering dominates and the valleys of the Bragg cross sections in polycrystaline materials induce reverse behavior. Large cross section has the effect that smaller amounts of an element can be detected with cold neutrons, i.e. higher contrast can be achieved. Large cross sections do on the other hand limit the sample size as the beam intensity is attenuated more rapidly. The aperture (D) of the beamline is an important part that together with the distance (L) to the samples position defines the the geometric unsharpness (d) of the imaging system, which can be described by pin-hole optics.
[2] ![]()
Figure 2: The ICON neutron imaging beamline. The components are; shutter system and an area for beam preconditioning (1), evacuated flight tubes leading to the first experimental position for high resolution imaging (2), followed by flight tubes leading to the second experimental position for voluminous and heavy samples and high L/D (3).
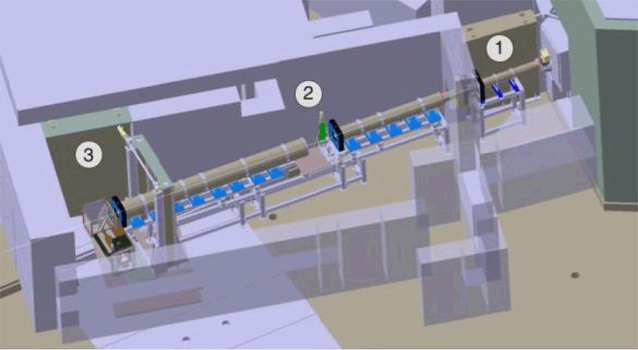
Figure 3: Neutron spectra of ICON and NEUTRA as measured with a time of flight method.
where l is the sample detector distance. The NEUTRA beamline has a fixed neutron aperture of 20 mm. ICON is constructed with an aperture drum providing five apertures from 1 mm to 80 mm. This gives L/D up to 10000. Vacuum flight tubes are installed to avoid flux losses from the source to the experimental position.
The experimental positions are equipped with linear positioning units and turntables. The linear unit is used to translate the sample in the plane perpendicular to the beam. The turntable allows acquisition of tomographic data sets. A palette of camera and lens systems makes both beamlines versatile user instruments. The cameras are mounted in light impermeable boxes that include tilted mirrors. With this arrangement the camera is placed outside the neutron beam to avoid direct neutron and gamma irradiation of the hardware. The cameras are focused on the scintillator which is placed directly behind the sample. The field of view can be chosen from 27-300 mm and depending on used scintillator-lens-camera combination resolutions up to 13.5 µm/pixel can be achieved. With a special device, an anisotropic resolution up to 10 µm in one direction can be reached.
A frequent imaging task of the beamlines is computed tomography. Depending on sample dimensions and requested resolution, scan times between a few hours and twenty hours can be expected. Tomography requires a processing step that transforms the projection data into a 3D volume. Normally, the filtered back-projection algorithm [KAK 01] is used. Depending on sample size and resolution the projection data sets contain 375 or 625 projections, in rare cases of very high resolution also 1125 projections are used. The exposure time per projection varies from a few seconds to a few minutes.
Recently an energy selector turbine was installed at the ICON beamline as a permanent part of the instrumentation. This turbine narrows the neutron spectrum to Δλ/λ=15%. The installation allows instant operation of the selector without a time consuming calibration step. Using energy selective imaging opens investigations of scattering in polycrystalline materials. The energy selector is also a fundamental component of the differential phase contrast setup. An upcoming addition to ICON’s instrumentation is a setup for grating based differential phase contrast (DPC) imaging [PFE 06]. This setup will allow investigations of low-contrast samples if their phase shifting properties are strongly differing from each other. In this case the DPC method will provide better contrast and an alternative data set containing the phase information of the sample.
2.4. Quantitative neutron imaging
Water is often the interesting component in neutron imaging experiments. One of the objectives is then to quantify the spatial distribution and amount of water in the sample. The problem is that water is a strong incoherent neutron scatterer. Most of the neutrons hitting the water molecules are scattered and only a small fraction is absorbed. Scatter has the effect that more neutrons are registered behind the sample than would be motivated by the sample thickness and composition if all neutrons were absorbed by the sample. In the reality the neutrons are scattered or even multiply scattered in the sample. This in turn results in misreading of the water content of the sample. The error can be up to 50% of the true water content. In tomograms scatter is identified by a cupped intensity profile, i.e. the central regions of the sample have lower intensity than the periphery.
The solution is to estimate the scatter component in the images and remove it as a correction procedure. The procedure developed by R. Hassanein [HAS 06] provides tomograms where the water content can be estimated with an accuracy of about 5%. The price of such correction methods is increased processing time and a decreased signal to noise ratio.
3. Comparing neutron and X-ray imaging
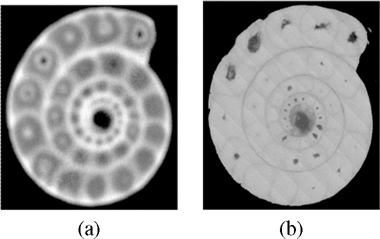
As pointed out in the previous section the difference between neutron and X-ray imaging is the attenuation mechanism that gives a completely different set of attenuation coefficients. For low energy X-rays the photo-electric effect dominates which gives pure attenuation. For neutrons, scattering contributes to the attenuation coefficient and is sometimes responsible for the main contribution of the attenuation. In figure (4) attenuation coefficients for some minerals are plotted to show which minerals are more suited for the two modalities [VON 05]. A first observation is that the attenuation is mostly lower for neutrons than for X-rays. This is relevant for large samples. Secondly there are some minerals for which the attenuation coefficients for both modalities increase in a similar manner. Finally there are some minerals for which the X-ray contrast is rather low but neutrons provide high contrast. In cases of mixed minerals some components may have high contrast with neutrons and others with X-rays. This can be used to increase the contrast of the images. An excellent example of the complementarity of the two image types is the ammonite in figure (5), [CAR 06]. Here, the thin septa between the chambers are altered due to iron hydroxides. The high hydrogen content provides high contrast in the neutron images. For X-rays the small mass density differences give relatively low contrast in the sample, only the walls have a good contrast.
With the XTRA option of the NEUTRA beamline a sample can be imaged with both neutrons and X-rays using the same setup and without moving the sample. This allows convenient pixel-wise comparison between images from the two modalities. The X-ray source works up to 320 kV and allows imaging of relevant samples.
A final difference to mention are the scan times required for the two methods. Using the XTRA option at NEUTRA the scan times are in the same order of magnitude, i.e. some hours. To achieve the highest resolution with neutron micro-CT often 10-20 hours are needed to complete a scan, this is an order of magnitude more than the time required to complete a scan at a synchrotron beamline like TOMCAT at the Swiss Light Source [STA 06].
Figure 4: Calculated linear attenuation coefficients of some selected minerals for X-rays and neutrons. The coefficients are based on information from [SEA 92]
Figure 5: Tomography of a pyritized ammonite using thermal neutrons (a) and X-rays at 150 kV(b).
4. Applications
4.1. Water movements and real-time imaging
Dynamic processes with fluids in porous media are often studied using neutron imaging. Especially interesting is water since it has a high contrast relative to the porous medium. Figure (6) shows an example of how a small amount of water is distributed in sand. This sequence was captured at eight frames per second.
Figure 6: A time series showing a droplet of water released on a sand sample. The lighter upper region is air and the darker region is a partly hydrophobic sand material.
To quantify the amount of water in a sample at time t, the following relation is used
[3] ![]()
[4] ![]()
where Lindex are the lengths of the medium and fluid respectively and Σindex are the macroscopic cross sections of the medium and fluid. These equations can be used together to compute the amount of water at each pixel in the image.
[5] ![]()
If ΣFluid is known it is possible to compute the amount of water for each pixel in the image.
For slow processes it is even possible to acquire low resolving tomographies as time series [KAE 05][SCH 08]. This allowed the study of the water movement during drainage and wetting of a constructed heterogeneous sand column. The column was constructed as an arrangement of cube shaped region. The sample was drained and wetted by elevating the water level. The cubes were identified in the images and the water content in each cube could be estimated. Figure (7) shows the water distribution in the sample column for different levels of the water table.
The feasibility of real-time imaging is a question of relating the time constant of the imaged process the possible acquisition time. If the process is too fast the camera may only be able to capture the dry and final state. Furthermore, tomographies of very fast processes would produce motion artifacts that makes any quantification impossible.
Figure 7: Wetting and draining of a heterogeneous sand column. The colors represent the water content in each cube when the water table is located 7, 34, and 12 cm below the sample.
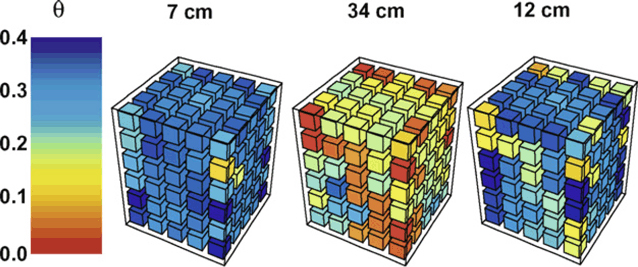
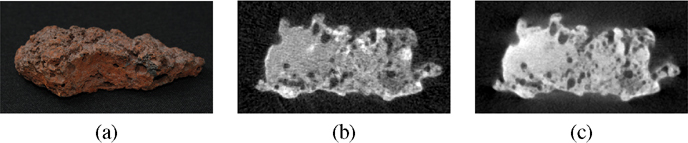
Figure 8: Tomographic cross sections of a bog ore sample (a) using thermal neutrons (b) and using X-rays at 250 keV, and with a 2 mm Cu filter (c).
4.2. Minerals
Figure 4 shows the linear attenuation coefficients for some minerals. This plot shows that many of the minerals have a higher attenuation with X-rays. The direct effect is that larger samples can be investigated with neutrons. Most interesting investigations can be made when the contrast between two materials is high then is possible to easily separate structures in the sample. This applies to both X-rays and neutrons. A second effect that can be investigated is when a beam-line is equipped with an X-ray source as previously described in section 3.
The first example in figure 8 shows the tomography of a piece of bog ore. The sample dimensions are about 30 mm × 50 mm × 100 mm. The main components of bog ore are iron oxides. The tomograms show first that neutrons are more suited due to the better penetration and second, the structures near the sample surface are displayed with a higher contrast.
The second example is also iron based. In this example, a piece of pyrite was investigated, see figure 9. The sample is approximately 40 mm thick. This sample was even harder for the X-rays to penetrate. This resulted in the streaks near the edges and the fuzzy edges. The acquisition with neutrons, on the contrary, did not suffer
Figure 9: Tomographic cross sections of a pyrite sample (a) using thermal neutrons (b) and using X-rays at 250 keV, and with a 2 mm Cu filter (c).
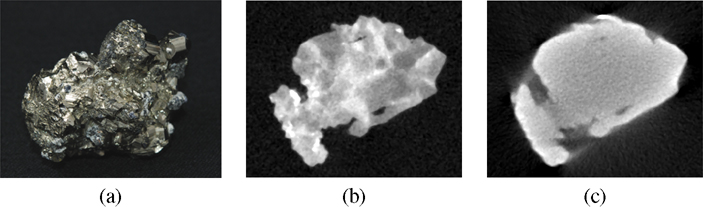
from intensity starvation and hence good tomograms resulted. Further on, the sample composition appeared to be ideal for neutron imaging. The larger crystal fragments appear with good contrast to the connecting regions. These structures do not appear in the X-ray tomogram which only reveals the shape of the sample.
4.3. Clays
Toxic waste deposal requires stable containment to avoid contamination of the ground water. Currently, in Switzerland the Opalinus clay is in focus for this task. The investigations are both considering the layered structure of this clays and the wetting of the clays. This is a novel task for neutron imaging that already has shown promising results. In the future, experiments showing the wetting of the sample will be used to verify models of reactive transport phenomena, [GRO 09]. The tomogram in figure (10) shows that the micro setup at ICON is capable of resolving the Illite and Calcite regions of the sample. These components both have lower attenuation coefficients than water, which makes neutron imaging the optimal method for future wetting and transport experiments. Complementary measurements will also be made using synchrotron based micro-tomography, micro X-ray absorption spectroscopy, and micro X-ray diffraction.
4.4. Concrete
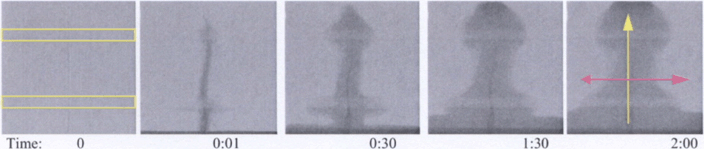
A technical application of neutron imaging is the study of concrete. Again water is central for the investigation. In an experiment reported by [ZHA 09], the water movements initiated by cracks in reinforced concrete were studied using neutron realtime imaging. Figure (11) shows a time-series of this experiment that clearly shows the water first entered the sample through the crack and then found preferential paths at the reinforcement. These kinds of experiments will provide models to predict the service life of reinforced concrete.
Figure 10: A tomogram of an Opalinus clay sample, courtesy of D. Grolimund, PSI. The sample diameter is 3 mm. The dark regions represents the Calcite domain and the lighter regions represent the Illite clay matrix.
Figure 11: Water penetration in reinforced concrete as function of time. Initially the water enters the crack, later the water finds preferential paths along the reinforcements. The yellow bars in the first frame indicate the location of the reinforcement in the dry sample.
5. Neutron imaging world-wide
Neutron imaging is available at about 15 different locations world-wide. The instrumentation vary in technical standard from beamlines with basic radiography capability and manual sample positioning to beamlines with advanced camera systems and automated sample manipulation that allows tomography. These beamlines are distributed on all continents giving the user community access to imaging beam-time for their experiments. The current status and progress of imaging beamlines world wide is reported by IAEA[IAE 08]. A list of neutron sources which are equipped with advanced neutron imaging beamlines is given in [LEH 09].
6. Summary
An overview of different applications of neutron imaging in geoscience has been given. Important for many applications is the presence of water which appears with high contrast compared to the medium it wets. The objective is often to study the distribution of water in the sample both at steady state and in dynamic processes. The important aspect is the ability to do this without adding any tracer element to water which would change behavior of the studied system.
In other applications the different set attenuation coefficients for neutrons may provide additional information to previous X-ray investigations. For many minerals the attenuation coefficient is lower for the neutrons; this allows the user to investigate inner structure of larger samples than with X-rays. These are some strengths of neutron imaging, but it must not be forgotten that neutron and X-ray imaging often are complementary and the use of one method does not exclude the other.
7. Acknowledgements
The the authors want to acknowledge the contributions from P. Lehmann, ETH Zürich, D. Grolimund, Paul Scherrer Institut, W.D. Carlson, The University of Texas at Austin, and F.H. Wittmann, Aedificat Institute Freiburg. Finally, the authors also want to thank L. Butler, Louisiana State University, for interesting discussions and suggestions.
8. References
[CAR 06] CARLSON W., “Three-dimensional imaging of planetary materials”, Earth and Planetary Science Letters, vol. 249, num. 3–4, 2006, p. 133–147.
[CAR 07] CARMINATI A., KAESTNER A., HASSANEIN R., VONTOBEL P., FLÜHLER H., “Infiltration through series of soil aggregates”, Advances in Water Resources, vol. 30, num. 5, 2007, p. 1168–1178.
[EIJ 04] VAN EIJK C., “Inorganic scintillators for thermal neutron detection”, Radiation Measurements, vol. 38, num. 4–6, 2004, p. 337–342, Proceedings of the 5th European Conference on Luminescent Detectors and Transformers of Ionizing Radiation (LUMDETR 2003).
[FIS 97] FISCHER W., “SINQ – The spallation neutron source, a new research facility at PSI”, Physica B, vol. 234–236, 1997, p. 1202–1208.
[GRO 09] GROLIMUND D., “Personal communication: Neutron tomography of Opalinus clay”, Personal communication, August 2009.
[HAS 06] HASSANEIN R., “Correction methods for the quantitative evaluation of thermal neutron tomography”, Diss. ETH No. 16809, Swiss Federal Institute of Technology, 2006.
[IAE 08] IAEA, “Neutron Imaging: A non-destructive tool for materials testing”, Research report num. IAEA-TECDOC-1604, September 2008, International atomic energy agency, Wagramer Strasse 5, PO Box 100, 1400 Wien, Austria.
[KAE 05] KAESTNER A., VONTOBEL P., HASSANEIN R., LEHMANN P., SCHAAP J., LEHMANN E., FREI G., LAESER H., FLUEHLER H., “Mapping the three dimensional water dynamics in heterogeneuos sands using thermal neutrons”, Proc. 4th World Congress on Industrial Process Tomography, 2005.
[KAK 01] KAK A., SLANEY M., Principles of computerized tomographic imaging, SIAM, 2001.
[KRA 88] KRANE K., Introductory nuclear physics, John Wiley & sons, 1988.
[LEH 09] LEHMANN E., KAESTNER A., “3D neutron imaging”, Encyclopedia of Analytical Chemistry, vol. a9123, 2009, John Wiley & Sons Ltd.
[PFE 06] PFEIFFER F., GRUNZWEIG C., BUNK O., FREI G., LEHMANN E., DAVID C., “Neutron phase imaging and tomography”, Physical Review Letters, vol. 96, num. 6, 2006, Page 215505.
[PLE 95] PLEINERT H., DEGUELDRE C., “Neutron radiographic measurement of porosity of crystalline rock samples: a feasibility study”, Journal of Contaminant Hydrology, vol. 19, num. 1, 1995, p. 29–46.
[SCH 08] SCHAAP J., LEHMANNN P., KAESTNER A., VONTOBEL P., HASSANEIN R., FREI G., DE ROOIJ G., LEHMANN E., FLÜHLER H., “Measuring the effect of structural connectivity on the water dynamics in heterogeneous porous media using speedy neutron tomography”, Advances in Water Resurces, vol. 31, num. 9, 2008, p. 1233–1241.
[SEA 92] SEARS V., “Neutron scattering lengths and cross sections”, Neutron News, vol. 3, num. 3, 1992, p. 29–37.
[STA 06] STAMPANONI M., GROSO A., ISENEGGER A., MIKULJAN G., CHEN Q., BERTRAND A., HENEIN S., BETEMPS R., FROMMHERZ U., BÄHLER P., MEISTER D., LANGE M., ABELA R., “Trends in synchrotron-based tomographic imaging: the SLS experience”, Proc. SPIE, Developments in X-Ray Tomography V, vol. 6318, SPIE, 2006.
[VON 05] VONTOBEL P., LEHMANN E., CARLSON W., “Comparison of X-ray and Neutron Tomography Investigations of geological materials”, IEEE trans. on Nuclear Science, vol. 52, num. 1, 2005, p. 338–341.
[ZHA 09] ZHANG P., WITTMANN F., ZHAO T., LEHMANN E., “Penetration of water into un-cracked and cracked steel reinforced concrete elements; visualization by means of neutron radiography”, Restoration of Buildings and Monuments, vol. 15, num. 1, 2009, p. 67–76.