
Comparison of X-ray CT and Discrete Element Method in the Evaluation of Tunnel Face Failure
ABSTRACT. A comparison of x-ray computed tomography and three-dimensional Discrete Element Method (DEM) analysis used in a boundary problem is presented. A tunnel face failure was simulated in a model test by pulling a cylinder out of a granular layer. The granular layer was investigated by X-ray computed tomography after pulling the cylinder and revealed a three dimensional face failure. The difference value of displacement of the cylinder made it possible to observe the mechanisms of development of the failure mechanisms such as arching effect. This experiment was reproduced with DEM. The mechanisms observed in the experimental study were well performed in one case. However, a second numerical analysis involving different particle shape (clump particles) was performed and showed a self-stable arch in the granular material, which was not observed in the experiment.
KEYWORDS: computed tomography, discrete element method, tunnel
1. Introduction
The study of boundary problems in geotechnical engineering is very important for a better understanding of the mechanisms involved in the interaction between soil and structures. The use of non destructive analysis techniques like X-ray computed tomography (CT) is a big issue for the study of boundary problems: experimental conditions very close to the in-situ conditions can be reproduced and are not disturbed by measurements apparatus located in the mass. In the other hand, Discrete Element Method (DEM) is a well-tried numerical tool for the numerical modeling of problem involving granular materials. Boundary problem can then be studied with CT from the point of view of the strain fields and DEM gives access to data related to both strain and stress fields. The aim of the study presented here was to compare both analysis techniques on an applied boundary problem: the evaluation of tunnel face failure. A tunnel face failure was simulated by pulling a cylinder out of a mass of sand. The failure zone induced by the removed cylinder was then investigated with x-ray CT. A three-dimensional slip surface was identified marking the boundary between the failure volume and the stable part of the granular material. In a second step, a DEM model was developed in order to analyze the same failure mechanism from a numerical point of view. Two different particle assemblies were considered in the numerical analysis, mainly differing by the shape of the particles involved. Calculation of the strain and stress fields in the samples was performed, so that the failure mechanisms were observed precisely in the numerical analysis and compared to the experimental results.
2. Methods
2.1. Experimental process
The test method consists of reproducing a tunnel face failure by pulling a cylinder out of a sand layer. First, a 125 mm diameter tank was filled (free-fall method) with sand with a relative density equal to 80%. Then, the soil tank is set in the pull-out system (Figure 1) and the cylinder was pulled with a constant velocity 0.1 mm/s. Once the desired displacement of cylinder was reached; the tank was placed in an industrial x-ray CT scanner booth (Otani et al. 2000; Otani et al., 2002) and scanned from the tunnel bottom to soil surface with a 1 mm pitch.
Two different sands were used differing by their grain size. The first one is a silica sand No.3 characterized by a mean grain size of 2.0 mm; its peak friction angle is 40° for a 80% relative density. The second one is a silica sand No.8 characterized by a mean grain size of 0.12mm; its peak friction angle is 42° for a 80% relative density.
Figure 1. View of the pull-out system
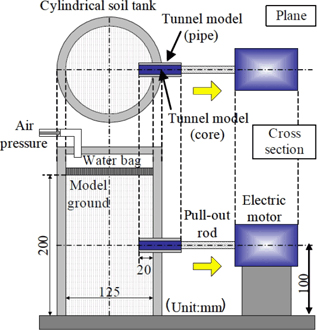
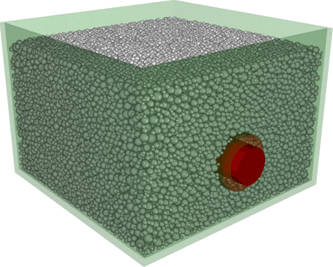
Figure 2. View of the test box for DEM analysis
2.2. Numerical model and process
Discrete Element Method was initially developed for the numerical study of rock mechanics (Cundall, 1979) and its fields of application were constantly widened. The numerical analyses presented here were computed with a C++ code called SDEC (Magnier, 1997). The model used here is based on molecular dynamics: particles are not deformable but an artificial deformability is simulated by the possible overlap between particles at their contact points. The successive applications of the Newton’s second law of motion and of contact laws make possible to reproduce the behavior of granular materials under various conditions. In our case, the contact force consists in two components. The normal component is perpendicular to the contact plane and is deduced from the overlap between contacting particles with a linear contact law of stiffness kn. The tangential component of the contact force is defined as Cundall proposed (Cundall, 1982) and is calculated with a linear contact law from the incremental tangential displacement of the contact point and a tangential stiffness kt. Normal and tangential components are linked by a Coulomb friction criterion of coefficient μ. A non viscous local damping (introduced by Cundall (Cundall, 1987)) is employed on the particles accelerations.
The three parameters of contact laws are kn=9.6×10⁴N.m−1, k/kn=0.75 and μ=30°. The global friction angle of the particles assemblies were deduced from numerical modeling of triaxial tests under 50 kPa confining pressure. The first assembly tested was composed on 80,000 spheres with diameter randomly drawn between 1.37 mm and 5.55 mm. The assembly had a void ratio equal to e=0.55 and a density of 17.1 kN.m−3. Its peak friction angle is 32°.
This value of friction angle is quite low compared to the friction angle of the real sand. However, friction angles greater than 35° can not be reproduced with simple spheres without introducing a resistance to rolling. Consequently, a second assembly was used made of clumps in order to obtain a particle assembly with mechanical properties closer to the real material. Due to their complex shapes (particularly local concavity), clumps assemblies can reach higher frictional strength.
The second assembly was composed on 80,000 clumps, made of two identical spheres which centers are separated by a distance of 50% of the sphere diameter. The sphere diameters were randomly drawn between 1.17 mm and 4.61 mm. The void ratio of the second assembly is equal to e=0.43 for a density of 18.5 kN.m−3 and a peak friction angle 46°. A test-box (Figure 2) with a 125×125 mm square section was used for the reproduction of the tunnel face failure. A cylinder with a 20 mm diameter was pulled out of the granular mass to induce a tunnel face failure.
3. Comparison and discussion
3.1. Face failure visualization
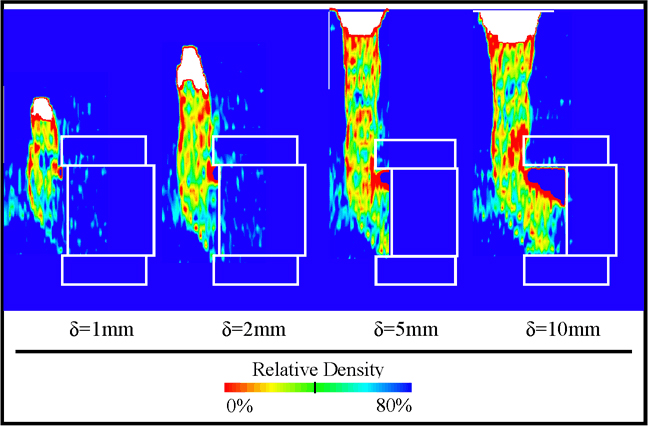
The DEM results were first compared with experimental pulling test on silica sand No. 3 (mean diameter 2.0 mm). This comparison was made because the grain size of this material is relatively close to the size of particles used in the DEM analysis. Figure 3 shows the distribution of the relative densities in a vertical cross section for the experimental test.
We can notice on this figure that pulling the cylinder out creates a face failure in front of the tunnel identified here with the progressive loosening of the soil mass. This loosening zone starts from the bottom of the tunnel and follows a slip line towards the surface of the soil layer (blue dotted lines). When the pull-out displacement is greater than 5 mm, the loosening zone expands vertically toward the surface, as observed in the trap-door tests.
Figures 4 and 5 represent the distribution of volumetric strains in cross sections respectively for the spheres and for the clumps particles. Strain tensors were calculated on tetrahedrons deduced from a Delaunay tessellation performed on the mass centers of spheres from the derivative of the displacement vectors of the vertex of the tetrahedrons (Cundall, 1989).
Figure 3. Distribution of the relative densities deduced from CT in vertical cross-sections: case of silica sand No. 3 (mean diameter 2.0mm)
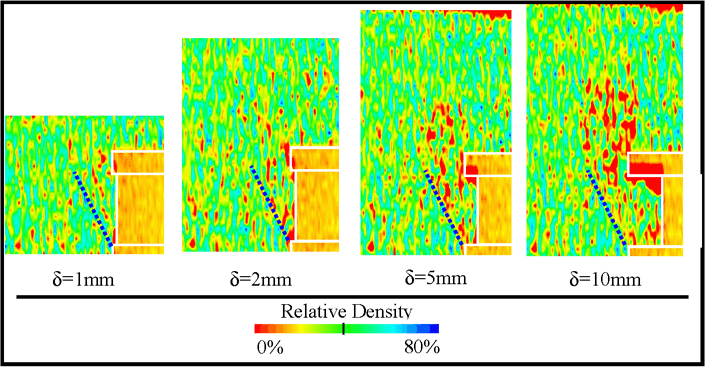
Figure 4. Distribution of the volumetric strains in vertical (right) and horizontal (right) cross-sections: case of the assembly of spheres
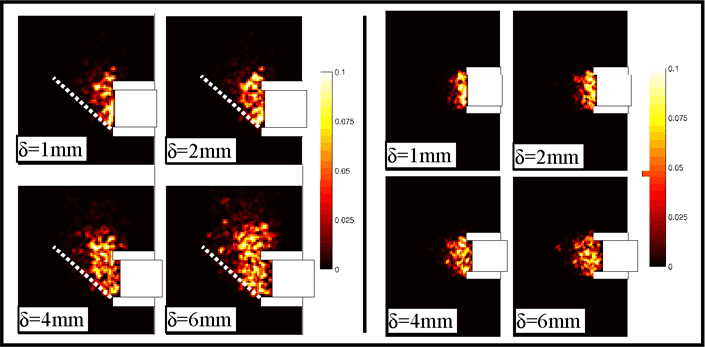
We can notice on Figure 4 (spheres) that the mechanisms obtained from numerical results are very close to the experimental results: the failure zone is also bound by a slip line starting at the bottom of the tunnel face. For greater displacement, the loosening zone expands vertically toward the surface. However, the angle between the slip line and the horizontal direction is less in the numerical results than in experimental tests. This could be related to the friction angles of both numerical and experimental samples: 32° for the numerical sample and between 40° and 42° for the sands.
Figure 5. Distribution of the volumetric strains in vertical (right) and horizontal (right) cross-sections: case of the assembly of clumps
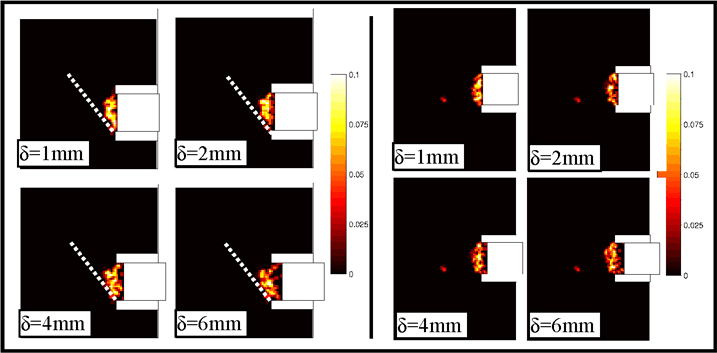
If we consider the other numerical sample (clumps, Figure 5), presenting a higher friction angle (45°), we observe that the angle of the slip zone with the horizontal directions is increased compared to the spheres samples. However, the loosening zone doesn’t expand toward the surface of the layer: a real self stable arch is formed near the tunnel face and prevents the effect of pulling the cylinder to spread into the granular layer. In order to illustrate the difference of the arching effect obtained with the 2 numerical samples, the distributions in vertical cross sections of the principal directions of the stress tensor are shown on Figure 6 for δ=6mm. The local stress tensors were calculated with the contact forces with the Love formula.
Figure 6. Principal directions of stress in e vertical cross-section for δ=6mm: for the sphere sample (left) and for the clump sample (right)
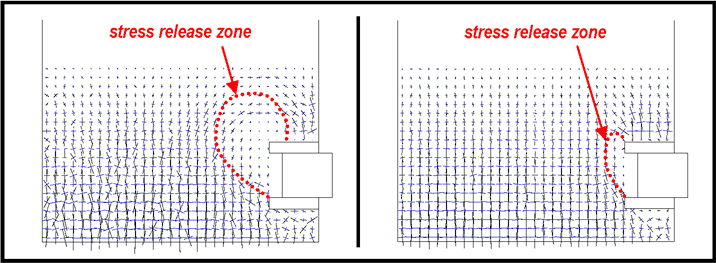
The stress release zone is much more reduced in the case of clumps, due to the formation of a self-stable arch. This perfect arching effect is due to the high level of imbrications between the clumps.
3.2. Effect of particle size
The comparison of the two different samples used in the numerical part of this study with each other on one side, and with the experimental results on the other side, suggests a strong effect of the particle size on the mechanisms observed. Indeed, each clump is made of 2 identical spheres, which centers are separated by a distance equal to 50% of the sphere diameter. Consequently, due to their concavity, clumps are very well imbricated and the loosening of the granular layer is then prevented. In addition, this effect of shape is coupled with an effect of the particle size, which also makes the gradual loosening of the layer harder. This effect of the particle size was also confirmed in the experiment by comparing the results obtained with the second sand (Keisa No. 8, mean particle size 0.12 mm). Figure 7 shows the distribution on vertical cross section of the relative densities in the case of Keisa sand No.8 to be compared with Figure 3.
Figure 7. Relative densities deduced from CT in vertical cross-sections: case of silica sand No. 8; white color corresponds to air voids areas
Comparison between the two sands, shows that with a smaller particle size (Figure 8, Keisa No. 8), the loosening area reaches the surface of the granular layer for δ=5 mm while in the case of bigger particles (Figure 3, Keisa No. 3), the loosening did not reach the surface. This strong effect of particle size cannot be ignored when performing a numerical study of this problem, especially using Discrete Element Method.
4. Conclusion
The reproduction of the three-dimensional tunnel face failure mechanism was investigated from both experimental and numerical point of view, using X-ray CT on one hand and Discrete Element Method on the other hand. The numerical model showed its ability to reproduce the mechanisms observed experimentally but with some limitation, essentially related to the combined influence of size and shape of particles. Considering the particle size issue, the perturbation of the granular mass consists here in a horizontal displacement which induces afterwards a vertical perturbation. If this displacement is too small compared to particle size, its effects are greatly limited. In the same way, if the resulting displacement field is not sufficient to induce a reorganization of the particles in the sample (loosening), the mechanisms can not be well reproduced. Particle shape is one of the methods to model particles assemblies presenting frictional strength closer to real materials. However, the introduction of concave particles and its direct influence on the particle arrangement (particularly contact density) seems to have a great effect on the arching mechanisms involved in the present failure problem. Consequently, further investigations should be made in fields of particle size and on particle shapes.
5. Acknowledgements
This research was conducted under the fellowship of the Japanese Society for the Promotion of Science (JSPS 20.08818).
6. References
Cundall P. and Strack O. D. L. “A discrete numerical model for granular assemblies”, vol. 29, pp. 47-65, Géotechnique, 1979.
Cundall P. A.; Dresher A. and Strack O. D. L. “Numerical experiments on granular assemblies: measurements and observations”, IUTAM Conference on Deformation and Failure of Granular Materials, 1982.
Cundall P. Analytical and Computational Methods in Engineering Rock Mechanics, Chap. 4, pp. 129-163, Allen & Unwin (Eds), 1987.
Cundall P. “Numerical experiments on localization in frictional materials” vol. 5, pp. 148-159, Ingenieur-Archiv, 1989.
Magnier S.A., Donzé F.V. Discrete Element Project. Report of the University of Québec, Montréal, Canada, 1997.
Otani J., Mukunoki T. and Obara Y. “Application of X-ray CT method for the characterization of failure in soils”, vol. 40(2), pp.111-118, Soils and Foundations, 2000.
Otani J., Mukunoki T. and Obara Y. “Characterization of failure in sand under triaxial compression using an industrial X-ray CT scanner”, vol. 1, pp.15-22, Journal of Physical Modeling in Geotechnics, 2002.
Takano D., Otani J. and Nagatani H. “Evaluation of three dimensional tunnel face failure using X-ray CT”, pp. 1639-1642, Proceedings of the 16th International Conference on Soil Mechanics and Geotechnical Engineering, 2005.