
On Pore Space Partitioning in Relation to Network Model Building for Fluid Flow Computation in Porous Media
From microtomography to pore networks
ABSTRACT. We present an improved method for generating a representative network model (NM) of a porous medium from the structure of its pore space. We differentiate the problem of positioning pore bodies (PB) and delimiting them via pore throats (PT). From a binary 3D microtomographic reconstruction of a porous material, we use the common watershed approach on the Euclidean distance map, examining several aspects in detail: the skeleton and the necessary pre-processing to remove digitization artefacts, the conversion to a graph that will support the NM, along with the post-processing needed to account for geometric features, delimitation of the PB by a watershed method and comparison to direct PT construction, and finally evaluation of the robustness of the NM generation by application on synthesized images of varying resolutions.
KEYWORDS: porous media, pore networks, skeletonization, x-ray microtomography
1. Introduction
Porous materials are studied in a wide variety of fields, such as Earth sciences, petrophysics, paper industry, metallurgy, etc. In these applications, pore scale fluid flow is of prime interest, but direct computation of pressure and velocity fields are extremely time and memory-consuming. Network models (NM) constitute a widely accepted alternative: in NM, the complex structure of pore space is represented by an equivalent network of pore bodies (PB) connected via pore throats (PT). Most of the initial works found in the literature were done on synthetic networks arranged in regular grids with simple geometric shapes of pores and throats, their size distribution adjusted by fitting experimental measurements such as mercury intrusion curves. With x-ray microtomography, direct visualization of the internal 3D structure of the pore space is available, making it possible to generate realistic NM. Usually, when real materials are considered, there is no “natural” partition of the pore space in PB and PT. Consequently, the partitioning process that generates this equivalent network must be defined in relation to its final usage. Starting from a 3D binary image of a porous sample, a skeleton of the pore space is built, using a distance-ordered homotopic thinning algorithm [Bertand and Couprie, 2007]. This skeleton is used to define a graph where nodes correspond to PB and branches to PT. Finally, the partitioning itself is performed to precisely delimit the PB associated to the nodes and the PT to the branches. In this paper different crucial steps of this process are analyzed in depth. Section 2 describes a new method to filter the image before skeletonization to avoid spurious branches and other topological artefacts. Section 3 presents the building of the graph, and section 4 describes PB delimitation. Results are presented for 3D images of synthetic materials.
2. Skeletonisation and digitisation artefacts
It is acknowledged that geometric and topological information are not exclusively sufficient to fully account for local features of pore space [Atwood et al., 2004]. The typical solution is to skeletonize the pore space and integrate additional geometric features to construct the graph. However, a well-known disadvantage of skeletonization is its sensitivity to small features. A cavity in an object will automatically result in a surface in the skeleton, regardless of its size and whether or not it is due to noise. Figure 1, for instance, shows a contact between two overlapping balls. The right image presents the resulting skeleton, joining the two ball centers by more than one branch. The bottom branch is due to digitization effects and should not be considered in the final NM. Methods such as median filtering do not handle all cases and modify an unreasonable amount of irrelevant pixels. We propose to directly identify pixels that are responsible for spurious information in the skeleton assuming it branches originates from features smaller than the pixel resolution, i.e. digitization artefacts.
Figure 1. Two overlapping balls and the resulting skeleton joining their centers. The lower branch (arrow) of the skeleton is obviously unreliable
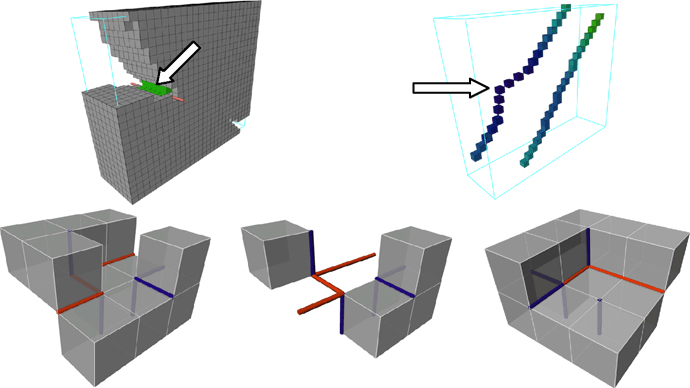
As the skeleton of a 3D object is at most 2D, we can classify these artefacts into three categories: 0D (or isolated pixels), 1D (branches), and 2D (surfaces). 0D artefacts are due to misclassification of pixels, typically pixels inside the solid are misclassified during binarization as void, and therefore results in single disconnected pixels in the skeleton. Filling small connected components of the pore space is sufficient to remove these. 2D artefacts are the dual situation from 0D, in the sense that they are caused by misclassifications in the void phase: small components of solid appear floating in the porosity. Again, removing small connected components of the solid phase resolves this issue (apart from border cropping effects, there is generally only one connected component for the solid). 1D or branch-type artefacts can be divided into two subtypes, since we consider 26-connectivity for the skeleton: cornerwise and edgewise artefacts. The former occurs when two void pixels are 26-connected and have no other void pixel in their common 26-neighborhoods, as illustrated in Figure 2. Characterization of these pixels can be done locally, using a 2x2x2 configuration given all possible rotations, and generation of the branch in the skeleton is avoided by first reassigning these void pixels to the solid phase. The latter artefacts are more difficult to detect because they are non-local. Edgewise artefacts are caused by two groups of 18-connected void pixels having no other void pixel in their common 26-neighborhood (arrow in Figure 3). In order to detect these pixels, we need to examine the edges of the pixels that are potentially responsible. Several notions are needed: we say an edge is strong if it is contained in at least three pixels of the void phase. An edge is called weak if it is contained in two void pixels that are 18- but not 6-connected. An edge chain is a sequence of edges sharing two by two a common vertex, and the edge chain extremities are the leading and tailing vertices. Finally, we affirm that an edgewise branch artefact is caused by a chain of weak edges having neither extremity connected to a strong edge. This notion is illustrated in Figure 3. With this novel approach to solve the problem of sensitivity of the skeleton to small features, only the pixels causing spurious information in the skeleton are, by construction, modified, therefore producing a minimal number of changes in the original binary image.
Figure 2. Left: near contact between two objects, with 6 cornerwise connections, which will result in 6 branches in the skeleton. Right: 2x2x2 configuration to test for each cornerwise branch-type artefact for removal
Figure 3. Illustration of edgewise branch-type artefacts: the top left image shows the pixels (arrow) responsible for the second branch in the skeleton, shown in the top right (arrow). The bottom left image shows the chain of weak edges, in light gray, detected by our method, and the containing pixels removed (bottom centre). The bottom right, however, shows a weak edge chain having an extremity connected to a strong edge, in dark gray, and is therefore part of a relevant connection to be kept in the skeleton.
3. Graph and post-processing
3.1. Topological classification of pixels
From a curvilinear or 1D skeleton, it is fairly straightforward to perform the conversion to a graph, which will be the starting point of the NM, where PB are defined by the vertices of the graph, and PT by the edges. If a pixel of the skeleton is neighbor to at most two other disconnected pixels, then it belongs to an edge of the graph, otherwise it is a vertex. Connected components of node pixels are grouped into a cluster, which identifies one PB. One difficulty is the fact that the skeleton can be 2D, i.e. contain surfaces. Since 2D artefacts were removed previously, the remaining surfaces are caused by cropping effects on the image boundary. Depending on the boundary conditions, they are either open (the exterior is considered as void) or closed (periodic boundary conditions). These surfaces can be removed by simply assigning all but the biggest connected component of the solid to the void phase [Lindquist and Venkatarangan, 1999], although this modification can lead to large void openings that affect flow properties. Instead, we choose to modify the topology of the skeleton by either anchoring surface pixels on the image border for open surfaces, or piercing closed surfaces before performing a second skeletonization. The positions of the anchors or piercings are decided on the distance of the pixels to the solid phase (maxima are used as anchors and holes are pierced at the minima). Of course, this type of modification requires that the surfaces be identified, and for this the topological classification of pixels from [Malandain et al., 1993] was used.
3.2. Node merging and insertion
Geometric information needs to be included into the graph so as to account for all the local features in the pore space. Firstly there can exist openings in the void phase that are not marked by a branch intersection in the skeleton, as in a chain of pores [Ioannidis et al., 1997]. Nodes are subsequently inserted along the branches where a significant maximum is found. The significance is determined by performing an H-maximum extraction on the branches. A small value of H (less than 4) is sufficient to ignore surface roughness effects [Soille, 1999]. Another common post-process is the merging of nodes when they identify the same opening in the pore space. Distance criteria are used to determine this. Many methods exist, supposed to be based on the amount of overlapping between the regions each node identifies. The two most common conditions are illustrated in Figure 4 with two nodes, and use the distance between them, and their distance from the solid, illustrated by their maximal balls. The left condition, center inclusion, merges nodes if one is contained in the maximal ball of the other. The right condition merges nodes if their maximal balls intersect.
Figure 4. Two common conditions for merging nodes in the graph. Left: center inclusion, and right: ball intersection
If the volumes of each region are sufficiently well represented by the maximal balls centered on the nodes, then we can say that the merging will depend on the amount of overlapping volume ![]() between these maximal balls
between these maximal balls ![]() (mi, ri) and
(mi, ri) and ![]() (mj,rj), where rx=d(mx). We therefore compute the ratio between this volume and the volume of the smallest maximal ball, and if it exceeds a fixed percentage (30% seems an acceptable value) then the nodes are merged. The following equation defines this condition:
(mj,rj), where rx=d(mx). We therefore compute the ratio between this volume and the volume of the smallest maximal ball, and if it exceeds a fixed percentage (30% seems an acceptable value) then the nodes are merged. The following equation defines this condition:
[1] ![]()
With the skeleton of the filtered binary image converted to a graph, and geometric information integrated in the data structure, the support for the NM is created. The nodes and branches of the NM have been positioned, but we now need to identify the PB and PT in the pore space, respectively.
4. Delimitation and validation
4.1. Region growing vs. throat construction
Two types of delimitation methods, PB detection and PT construction, were tested. While the first relies on classical region growing approaches, the second requires new and specific implementations. For the former, we have used the topological watershed algorithm proposed by [Bertrand, 2005]. The inverse of the distance map is used as a relief, and the minima, considered as catchment basins in flooding semantics, are to be separated along the most significant crest lines. Of course, the graph created in the previous section is used to define the basins to separate (all regional minima not identified by a node of the graph will be filled in before the watershed). This algorithm creates a pixel-thick watershed, and to obtain a thin separation, these watershed pixels are assigned one of their neighboring PB according to the value in the distance map of the PB pixels. Available work on the second type of delimitation, PT construction, originally strictly applied the definition of Dullien given for a pore: “portions of the void space confined by solid surfaces and planes erected where the hydraulic radius of the pore space exhibits local minima” [Dullien, 1991], but it is clear that planar separations are not adaptable to the complex structures of real materials, and non-planar separations are preferable. The method similar to that of [Shin, 2002] was implemented: at the minimum distance to the solid along each branch of the graph, the closest solid pixels in angular wedges around the branch are determined. Then the 6-connected shortest path of solid pixels on the interface with the void and passing through every pixel detected in each wedge is found. This path defines the border of the PT which is then triangulated. This process is repeated for every branch of the NM, and naturally divides the pore space into PB.
4.2. Evaluating the robustness
These delimitation methods are tested on a random close packing of balls, for which the ball radius is sequentially increased, and at digitizations of varying resolutions. The results, plotted in Figure 4, show that overall the watershed algorithm performs better than the PT construction approach.
Figure 5. Percentage of error on the delimitation, as a function of image resolution and ball radius increase (from 0 to 10% increase). On the left, by PT construction, and on the right PB detection
The error obviously becomes significant when overlapping is so important that individual balls become unidentifiable. In the low resolution image with a 10% radius increase, a PB consisting of 28 balls of the original packing is observed, but a pertinent decomposition because the resulting pore contains neither cavities nor tunnels.
5. Conclusions
We have presented in this paper the necessary stages for obtaining a representative NM from a binary image. An efficient skeletonization algorithm is chosen, along with the exact Euclidean distance for centeredness. Furthermore, we correctly handle the problem of digitization artefacts in the skeleton by a novel prefiltering method. Topological classification of the skeleton pixels is performed, to detect branches and intersection, but also surfaces, which are thinned by a second skeletonization procedure. Geometric information is added to this graph, with a new node merging condition based on maximal ball overlap volume. Finally, pore delimitation procedures are compared, and we show quantitatively that a watershed approach is more efficient than direct PT construction, by application on modified random close ball packings at different resolutions.
6. References
Bertrand G., Couprie M., “Transformations topologiques discrètes”, in Géométrie discrète et images numériques, pages 187–209, Paris, Hermès-Lavoisier, 2007.
Bertrand G., “On topological watersheds”, J. Math. Imaging Vis., vol. 22 no. 2-3, 2005, p. 217–230.
Ioannidis M. A., Kwiecien M. J., Chatzis I., MacDonald I. F., Dullien F. A. L., “Comprehensive pore structure characterization using 3d computer reconstruction and stochastic modelling”, Proceedings of the 1997 SPE Annual Technical Conference and Exhibition, 1997, Part Omega (pt 1).
Malandain G., Bertrand G., Ayache N., “Topological segmentation of discrete surfaces”, International Journal of Computer Vision, vol. 10 no. 2, 1993, p. 183–197.
Dullien F.A.L., Porous Media: Fluid Transport and Pore Structure, Academic Press, 1991.
Lindquist W.B., Venkatarangan A., “Investigating 3d geometry of porous media from high resolution images”, Physics and Chemistry of the Earth, Part A: Solid Earth and Geodesy, vol. 24 no. 7, 1999, p. 593–599.
Atwood R.C., Jones J.R., Lee P.D., Hench L.L., “Analysis of pore interconnectivity in bioactive glass foams using x-ray microtomography”, Scripta Materialia, vol. 51 no. 11, 2004, p. 1029–1033.
Shin H., A throat finding algorithm for medial axis analysis of 3D images of vesiculated basalts, PhD thesis, 2002, State University of New York at Stony Brook.
Soille P., Morphological Image Analysis, Berlin, Springer-Verlag, 1999.