
Application of Microfocus X-ray CT to Investigate the Frost-induced Damage Process in Cement-based Materials
ABSTRACT. This paper presents a methodology to investigate the damage process in cement-based materials that have been subjected to freezing and thawing action. The microfocus x-ray computed tomography (CT), a non-destructive and non-invasive imaging technique, allows us to examine the cracks in the damaged mortar at a resolution of the order of 10 micrometers. Image processing and analysis of the microtomographic images are also applied to gain three-dimensional (3D) information of the internal microstructure. This information can be used to quantify the damage parameters on the basis of the 3D characterization of cracks in the damaged mortar. Representative samples of the analyzed volumetric data are presented to demonstrate the feasibility of the proposed method.
KEYWORDS: freezing-thawing action, microfocus x-ray CT, image analysis, crack, mortar
1. Introduction
X-ray computed tomography (CT) is a non-destructive technique to examine the internal structure of objects by creating three-dimensional (3D) images that map the variation of the x-ray attenuation coefficient. Although this technique is widely used as a medical diagnostic tool, it has also been shown to be very useful in material research. For example, medical and industrial CT scanners allow non-destructive imaging of many geomaterials like soils, concrete and rocks at spatial resolution that could range from an order of 100 micrometers to a few millimeters. With the recent development of microfocus x-ray CT (micro-CT) having spatial resolutions down to sub-micron to few µm, its potential to study the microstructure of geomaterials becomes more appealing to many. In this paper, we focus on the application of microfocus x-ray CT to investigate the internal structure of cement-based materials exposed to freezing-thawing action.
The freezing-thawing action is one of the most significant causes of deterioration in concrete structures particularly in cold regions such as that of Hokkaido, Japan. Concrete and mortars that are not resistant to cyclic freezing-thawing action manifest two principal types of damage namely surface scaling and internal cracking. Several methods have been developed to observe and quantify these types of damage caused by freeze-thaw (FT) cycles. For example, the surface scaling can be measured by weighing the scales formed from the specimen. As for internal cracks, the scanning electron microscopy (SEM) and optical microscopy (OM) have been the most widely used technique to characterize the cracks in cross-sections of mortar or concrete.
In contrast to the conventional 2D microscopy techniques, micro-CT can be used to examine the frost-induced cracks in three dimensions without the time-consuming and difficult sectioning of specimen. The purpose of this study is therefore to illustrate the feasibility of using the microfocus x-ray CT coupled with image analysis to visualize and quantify the air voids and cracks in a mortar specimen subjected to freezing-thawing action.
2. Experimental procedure
2.1. Material tested for freezing-thawing experiment
The material tested for this study was a non-air-entrained fly ash mortar with a fly ash replacement of 30%, a water-to-binder ratio of 0.50 and a sand-to-binder ratio of 2.50. The cement used was an ordinary Portland cement (OPC) designated as JIS R5210 whereas the fly ash is of JIS type II. The river sand used in the mixture is of sizes that range from 0.15 mm to 2 mm.
In accordance to JIS R5120, the casting in 4 cm × 4 cm × 16 cm steel mold was performed; and then after removing the specimen from the mold, the specimen was cured under water. After 14 days of curing, a 12-mm cored sample was obtained from the hardened mortar specimen. A cylindrical specimen with aspect ratio (L/D) of 2 was prepared for the freezing-thawing experiment.
In the freezing-thawing experiment, the cylindrical specimen was cyclically exposed to freezing in water at −20° C and then thawing in water at 18° C in an air-temperature controlled room. One cycle of freezing and thawing took about 12 hours. After a specified number of freeze-thaw cycles, the specimen was removed from the controlled room, and then the central portion of the specimen (about 12 mm and 8 mm in diameter and height, respectively) was scanned with x-ray CT (see Figure 1).
2.2. Image acquisition using microfocus x-ray CT
Acquisition of 3D images of the internal structure of the specimen subjected to cyclic freezing-thawing environment was done using a desktop microfocus x-ray CT system (TOSCANER-30000µhd, Toshiba IT & Control Systems Corporation, Japan). The micro-CT consists of a microfocus x-ray source, a specimen manipulator, an image intensifier (II) detector coupled to CCD camera, and an image processing unit.
In this experiment, a power setting of 130 kV and 124 µA was used for a full (3600 rotation) cone-beam scan with 1,500 projection views. The specimen was set in a holder mounted on a precision rotation table, and then the table position was adjusted to fit the image within the field-of-view. Calibrations and setting of scan parameters and conditions prior to scanning were performed to obtain high resolution images, as well as to reduce the noise and artifacts during image acquisition.
Figure 1. CT data from scanned section of specimen
3. Results and discussion
3.1. Microtomographic images from cone-beam scanning
Figure 1 depicts the reconstructed CT data obtained from cone-beam scanning of the central portion of the cylindrical specimen. From the reconstructed images, 199 contiguous slices were obtained such that each slice has a thickness of 40 µm. Stacking up these slices creates the 3D image of the scanned section of the specimen. Each slice or cross-sectional image consists of 1024 × 1024 pixels with a square pixel size of 12 µm. Accordingly, the voxel (volume element or volumetric pixel) of the CT image has anisotropic size of 12 × 12 × 40 µm. Each voxel is associated with the so-called CT number (CTN) which is proportional to the average x-ray attenuation coefficient of the material in the said voxel. Since the attenuation coefficient is a sensitive measure of atomic composition and density, the voxels associated with low-density phase such as air or water have much lower CT number as compared with that of the solid matrix of the mortar. By convention, the higher CT numbers were shown in the images as brighter voxels relative to that of the lower CT number.
Figure 2. CT histogram of a cross-section and the corresponding 8-bit images
Figure 2 shows an example of an 8-bit grayscale CT image obtained from rescaling the 14-bit raw CT data. As shown in the histogram of the CT number, there are two distinct peaks which are associated with the air and the solid matrix, respectively. Depending on the setting of the window level (WL) and width (WW) or the minimum and maximum CTN cut-off, different brightness and contrast of the image can be obtained from the raw CT data. For this study, the CT data were transformed to 8-bit grayscale images (e.g. TIF images) by setting the window level and width to 400 and 700, respectively. In other words, we used 50 and 750 as the minimum and maximum cut-off CTN, respectively to give a better contrast between the air (first peak) and the mortar matrix (second peak). In this case, any voxel with CTN less than or equal to 50 was transformed to a grayscale value (GSV) of zero (black) whereas any voxel more than 750 was transformed to a GSV of 255 (white). For voxels with CTN between 50 and 750, the following scaling was used in transforming the CTN to 8-bit (0-255) GSV: GSV = (255/700) (CTN – 50).
3.2. Image processing and analysis of scanned section of specimen
In this study, the freely-available programs such as ImageJ (Rasband, 2007) and SLICE (Nakano et.al, 2006) were used for image processing and analysis. For example, anisotropic diffusion filter was applied to the stack of CT images for denoising prior to subsequent analysis. Sample cross-sectional images of the specimen after 3, 9 and 35 freeze-thaw (FT) cycles are shown in Figure 3. In this figure, the entrapped air voids and cracks were shown as black whereas the cement pastes were imaged as dark gray. On the other hand, the aggregates (sand) were imaged as patches of different shades of gray in the microtomographic images. Notice that most of the cracks meander around the aggregates suggesting that the internal cracks attempt to follow the weaker interfacial transition zone (ITZ) between the sand and the cement paste in the frost-damaged mortar.
Figure 3. Sample slices at different FT cycles
Figure 4. Extraction of void space from micro-CT image
3.2.1. Extraction of air void or cracks from the microtomographic images
To quantify the air void or cracks, image segmentation using global thresholding was used to separate the void space (air void or crack) from the solid mortar matrix. The grayscale threshold value was selected as one half of the grayscale value (GSV) of the peak associated with the solid matrix as shown in Figure 4a. Thus, any voxel with a GSV below or equal to this threshold value is considered void space and colored as black (or white). Otherwise, any voxel with GSV above this threshold value is considered as solid and made as white (or black). Such thresholding routine results to binary images (e.g. Figure 4c and 4d) that can be used to further analyze the void space. However, to separate the surrounding background from the void inside the specimen, additional image operations were done. By applying a fill-hole binary operation, a solid foreground image (Figure 4e) was produced and then used to separate the interior void space from the exterior space. The image arithmetic operation of addition was applied to the said image (Figure 4e) and the binary image (Figure 4c), resulting to an image (Figure 4f) that includes only the internal void space. The void fraction of the scanned specimen can be easily quantified by dividing the total number of internal void voxels (e.g. black in Figure 4f) with the total number of foreground voxels (e.g. black in Figure 4e).
3.2.2. Visualization and quantification of void space
Figure 5 shows the slice-wise void fraction along the height of the scanned specimen at different freeze-thaw cycles (FTC). Note that at the early stage of FTC, no clear cracks were observed and the estimated void fraction was found to be 1.3%. This value seems to be reasonable for the initial air content of non-air-entrained mortars. As expected, a significant increase of void fraction (6.3%) was then observed at 35 FTC because of internal crack formation.
Figure 5. Void fraction at different FT cycles
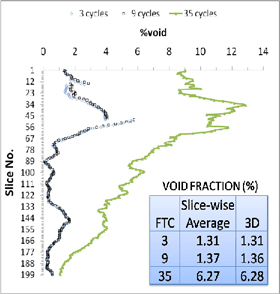
Figure 6. Volume rendering and connectivity analysis of the 3D void space
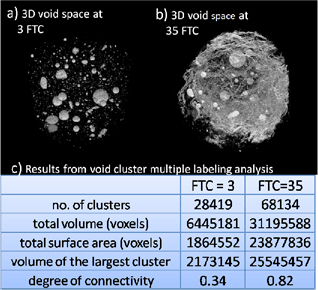
Figure 6 shows the volume rendering of the 3D void space at 3 FTC and 35 FTC, respectively, as well as, some results from connectivity analysis. Such connectivity analysis (Nakashima and Kamiya, 2007; Promentilla et. al, 2008) through multiple cluster labeling algorithm allows us to identify, label, and then measure the individual void objects (or clusters). Prior to this analysis, the stack of 3D image was also rescaled along the z-axis using cubic-spline interpolation to create an isotropic voxel of 12 µm. Volume was determined by the number of void voxels in the cluster while surface area is determined by the number of interfacial voxel faces that are in contact with solid voxel. The degree of void connectivity was obtained from the volume ratio of the largest void cluster to the total void space. The results suggest that the generation of frost-induced cracks had caused the increase of the total volume and surface area of the void space. Moreover, the degree of void connectivity increased dramatically from 0.34 to 0.82 at 35 FTC, indicating that the individual cracks form a well-connected crack system in three dimensions.
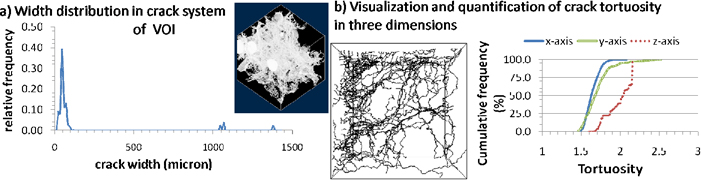
Furthermore, studies are currently being conducted to characterize this connected crack network in terms of crack width distribution and tortuosity. Figure 7 shows some preliminary results of the internal crack width distribution and crack tortuosity in a selected cubic volume of interest (VOI = 63 mm3). The crack width distribution was measured based on the local thickness calculation using direct distance transformation method developed by Hilderbrand and Ruegsegger (1997). As for crack tortuosity, the 3D medial axis method (3DMA) developed by Lindquist (1999) was used. The geometric tortuosity (τ) was calculated as the shortest paths along the void medial axis for x, y, and z-directions using τ = l/Δ where l is the actual path length and Δ is the linear separation of the two parallel planes of the VOI.
Figure 7. Crack width distribution and crack tortuosity in a given volume of interest
4. Conclusion
Although this study is limited in its extent, the findings demonstrate the promising potential of micro-CT as a noninvasive and nondestructive technique to investigate the damage caused by freezing-thawing action in cement-based materials. The micro-CT with the aid of image analysis allows us to visualize and quantify air void and crack in the mortar specimen at spatial resolution of 10 µm order. Measurement of void fraction including the volume, surface area, and degree of connectivity of void space in three dimensions could provide useful insight into the damage evolution caused by freeze-thaw cycles. Quantification of 3D parameters such as crack tortuosity (Promentilla and Sugiyama, 2009) based on random walk simulation may also be used in material models that are based on a realistic physical picture of the microstructure of the frost-damaged mortar.
5. Acknowledgments
Part of this research is funded by Research Grant from the Japan Society for the Promotion of Science (Kiban Kenkyu B, Sugiyama, T. Research No.19360193). The authors would like to thank Prof. Kaneko and Dr. Kawasaki for allowing them to use the micro-CT scanner and also to Mr. Hatakeda and Dr. Shimura for his assistance in the preparation of the specimen. The first author also acknowledges the postdoctoral fellowship support from the Japan Society for the Promotion of Science.
6. References
Hilderbrand, T., Ruegsegger, P., “A new method for the model-independent assessment of thickness in three dimensional images”, Vol. 185, pp.67-75, Journal of Microscopy, 1997.
Lindquist, W.D., “3DMA General Users Manual”, State of New York at Stony Brook: New York, 1999.
Nakano T., et al., “SLICE –Software for basic 3-D image analysis.” Japan Synchrotron Radiation Research Institute, 2006. Available from: http://www-bl20.spring8.or.jp/slice/.
Nakashima Y., Kamiya, S., “Mathematica programs for the analysis of three-dimensional pore connectivity and anisotropic tortuosity of porous rocks using X-ray microtomography”, Vol. 44, No. 9, pp.1233-1247, Journal of Nuclear Science and Technology, 2007.
Promentilla, M.A.B., Sugiyama T., Hitomi, T., Takeda, N., “Characterizing the 3D pore structure of hardened cement paste with synchrotron microtomography”, Vol. 6, No. 2, pp. 273-286, Journal of Advanced Concrete Technology, 2008.
Promentilla, M.A.B., Sugiyama T., “Computation of crack tortuosity from microtomographic images of cement-based materials”, In press, Proceedings of the Twelfth International Conference on the Enhancement and Promotion of Computational Methods in Engineering and Science, China, 2009.
Rasband, W., “Image J: Image processing and analysis in Java”, National Health Institute, 2007, available from: http://rsb.info.nih.gov/.