
Quantification of Material Constitution in Concrete by X-ray CT Method
ABSTRACT: The x-ray CT (Computed Tomography) technology used for non-destructive testing techniques is able to visualize the internal structure of material objects without damaging them and also to analyze its images quantitatively by using the CT value, a numerical value for a scan image as taken by an x-ray CT scanner. By using these characteristics, this research paper will propose a method for setting a “new boundary CT value (threshold value)” to separate each of the constituent materials, such as aggregate, mortar, void from a CT value histogram of a sectional plane image of concrete. It will also apply this method to a concrete test specimen so as to clarify distribution characteristics of void ratio, aggregate ratio, and the relative density of mortar.
KEYWORDS: x-ray CT, scanner, quantitative evaluation, concrete constitution
1. Introduction
The x-ray CT method is an effective method for concrete research and diagnosis. Its effectiveness shows promise for enabling the 3D solid display of steel bar, void, or cracking inside concrete columns.
In contrast, concrete consists of water, cement, sand and gravel. Its mechanical characteristics and durability are influenced by the constituent materials or the ratio of compounds. X-ray computed tomography (CT) provides information about the density of each of a material compound. We have conducted studies on aggregates and voids on the vertical profile in the concrete and on method to evaluate concrete with different water:cement ratios by using average CT values of the mortar (Temmyo et al. 2003, 2006)
To quantitatively study concrete composition of each material, i.e. density or size, it is important to set an appropriate threshold values in the CT for each material during image processing. In fact, we set the threshold value so that objectives are “the most easily viewed” in CT images. Although this method is realistic for human evaluation, a more objective method of image processing is required for engineering. Here, we divide concrete into populations of large aggregates, mortar and small aggregates, and large voids, and propose a method to quantify material composition by using a histogram of the CT values obtained from planar images to quantify each population in terms of density and volume.
2. X-ray CT method
We used an industrial x-ray CT Scanner, TOSCANER20000RE made by Toshiba (Figure 1). In the x-ray CT scanner, the x-ray tube can be adjusted to 300, 200, and 150kV, It has 176 detectors fixed on the same horizontal plane. These can be moved in a vertical direction. Additionally, a rotating turntable is ued to rotate the sample as necessary. Five slice thicknesses can be selected; 0.3, 0.5, 1.0, 2.0 and 4.0 mm. The scan area can be selected from two areas, either φ150 mm or φ400 mm. The highest resolution of image display is 2048×2048 pixels. For this research, the scan is set to parameters displayed in Table 1.
Figure 1. X-ray CT scanner
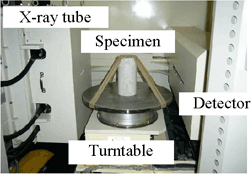
Table 1. Specification of x-ray CT scanner
| Scan type | Traverse/Rotation |
| X-ray tube voltage | 300kV |
| X-ray tube current | 2mA |
| Nos. of detectors | 176 |
| Thickness of slice beam | 2.0mm |
| Scan area | 150mm (Diameter) |
| Nos. of display pixels | 1024×1024 pixels |
3. X-ray CT image and CT value
An example of a CT image for a φ125 mm concrete column specimen is shown in Figure 2. The resolution of the x-ray CT image is 0.146 mm in the horizontal. The CT value of each voxel (volume of 0.146×0.146×2.0 mm3) is determined as defined by the following formula:
(2) ![]()
where μt is the x-ray absorption coefficient and μw is the water absorption coefficient. K is an arbitrary coefficient set to 1000 in this research. As the x-ray absorption coefficient is almost proportional to the density of an object, the CT value is considered to be a value proportional to the density with high CT values correlating to high density (white in images) low CT values corresponding to low density (black in images). Three materials are shown concrete specimen image (Figure 3); the white area is aggregate, grey area is mortar and a black area is void. Here we will section the concrete into these three materials. Figure 3 is a histogram of the CT values used to extract the three materials found in Figure 2.
Figure 2. X-ray CT image of concrete
Figure 3. Histogram of CT value
4. Quantification method for material constitution in concrete
4.1. CT value of the void-mortar boundary
4.1.1. Finding the CT value of the void-mortar boundary
The amount of void in the concrete specimen is minute when one considers its ratio. It can also be considered to be included in mortar. However, it is possible, to enhance precision in the quantitative assessment of the average CT value.
While the theoretical CT value of air was set to −1000, however CT values similar to this value are rate in the histogram, and the ratio of pixels with a CT value of 0 is about 0.7%, or much lower than the 4% included in the concrete specimen during mixing. This may be because the air was not fully resolved by the voxel size used here. Hence, considering the theoretical amount of air as shown in the histogram in Figure 3, the CT value of void is around 0 to 500 due to voxel effects. When dips in the histogram are present, it is easier to decide the boundary than when the curve is smooth at an obvious boundary between the materials. So to decide the characteristic point from the smooth histogram in Figure 4(a) objectively, the threshold value was determined by differentiating histogram function. First, set a function that shows a histogram of the CT value as ƒ (CT); two apply a third order differential to it and evaluate the threshold value (Figure 4b). As a characteristic point rapidly increases in CT value, d3f/d (CT)3=0, we set the void-mortar boundary CT value, as 361 in the Figure 2 example.
Figure 4. Differentials of CT histogram function
Figure 5. Binary image of void
4.1.2. Evaluation of void ratio
The image was converted to a binary image, where solids are 1 and voids are 0 to determine the void fraction (Figure 5) by using the threshold value between void and solids. Then all the void is assigned a value of 0 and the solid is assigned a value of 1. Here, if we define a value of the divided total sum of black area by the sectional plane area of specimen as void area rate, the rate will be 2.0% for this image. While this is for a plane image, it serves as an index for the composite material.
4.2. CT value of the aggregate-mortar boundary
4.2.1. Phantom
In the materials that constitute concrete, highest density material is aggregate followed by mortar. These CT values are plotted in the high-value area in the histogram of Figure 3. However, it does not show the characteristic bimodal shape that can be used to differentiate the material types in the area.
Hence it is impossible to use this method to decide the void-mortar boundary CT value here. So we adopted a method called the “Percentile (P-tile) Method”. The percentile method decides the threshold value objectively and stably i.e. scanning an objective whose sectional plane area is already known, that is a phantom, together with the specimen, then decides threshold value by using the given value. In this percentile method, a planar section of the material shown in Figure 6 was scanned. At the same time, we scanned the specimen and the phantom to obtain values for the percentile method (Figure 7 and 8). Then a histogram was used to determine the CT value (Figure 9) from which a value of 1,092 was determined.
Figure 6. Phantom
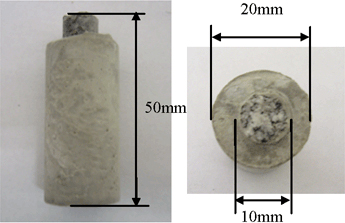
Figure 7. Specimen and phantom
Figure 8. Enlarged view of phantom
Figure 9. CT value histogram of phantom
4.2.2. Evaluation of aggregate ratio
A binary image (white and black) to differentiate aggregate from mortar is shown in Figure 10, which is used to confirm the shape of aggregates in the concrete. In this image, if we define a value for the total area divided by the black parts in the concrete specimen, the percent will be 45.1%.
Figure 10. Binary image of aggregate
Figure 11. Boundary CT value of aggregate and mortar by phantom and mean CT value of mortar specimen
The aggregate area ratio is a two-dimensional aggregate ratio calculated from the sectional plane image. This differs from the general aggregate ratio, yet it is an index of the aggregate proportions.
5. Application to concrete specimen
5.1. Boundary CT value in scan sectional plane of mortar specimen
In case that x-ray CT, is applied to the concrete specimen to conduct its quantitative assessment at a range of points, sometimes sample density is not readily obtained, especially when a homogenous specimen is scanned in several sectional planes, CT values often differ slightly.
To demonstrate this effect, we scanned a mortar specimen for indoor testing of φ125 mm, height 250 mm and a phantom simultaneously per 25 mm. We assessed the average CT value and aggregate-mortar boundary CT value of the specimen for ten sectional plane images. The result is shown in Figure 11. The mean CT values vary at different heights. The main cause for this may be the inhomogenous nature of the specimen, but CT values for the aggregate-mortar boundary are somewhat uneven. As shown in the experiments described above, it is possible to enhance quantitative precision by scanning every sectional plane and comparing this to a phantom similarly scanned.
5.2. Boundary CT value of concrete specimen
We created a concrete specimen of φ125 mm, height 250 mm and scanned 10 sectional planes increasing the height by 25 mm each time along with a phantom. The concrete mix is a water-cement ratio 55%, fine aggregate ratio 40% with this broken into a volume ratio of fine aggregate with grain diameter 5 mm or large to be 43%, and that smaller than 5 mm to be 29%. We assessed each area ratio by applying the “boundary CT value assess method”.
The scan station and void area ratio, aggregate area ratio that we assessed are shown in Figure 12. Though the void area ratio shows constant values not dependent on area, the aggregate/area ratios are uneven. It can be thought that this is due to the aggregates settling to the lower part of the specimen during material preparation, such that CT values are larger at the base of the specimen.
Lastly, we examined the mean CT value distribution of mortar. The range between the void-mortar boundary CT value and the aggregate-mortar boundary CT value can be considered as the mortar’s CT value distribution, so we adopted the average CT value of this range as a mortar average CT value (Figure 13). As the CT value is proportional to density, Figure 14 can be regarded as relative mortar density distribution; density increases with depth.
Figure 12. Voids and aggregate rate in the specimen
Figure 13. Mortar mean CT value in the specimen
From this finding, it is clear that even specimens created using formwork, have distributions in the specimen. Hence when material assessment are collected prior to core compression tests, it is desirable to scan several sectional planes, assess their CT value, and adopt these values as the material constituent characteristics.
6. Conclusions
In this paper, concrete material constituents were evaluated using x-ray CT and we proposed a method for quantifying material constituents using sectioning of the CT images into the three concrete components: aggregate, mortar and void.
A threshold value was chosen to asses the boundary values within the concrete by finding the characteristic point from histogram of CT value and then applying a differential processing to it as well as by scanning the sample in the presence of a phantom of known properties. As a result, it becomes possible to determine the boundary CT value precisely and objectively and that the void area ratio, the aggregate area ratio and the relative density distribution of mortar can be quantified.
7. References
T. Temmyo, T. Tsutsumi, Y. Murakami, Y. Obara. (2003), “Estimation of structural characteristics of RCD by an X-ray CT method”, Geo-X 2003, X-ray CT for Geomaterials, Soiles, Concrete, Rocks, 199-205.
T. Temmyo, Y. Murakami, Y. Obara. (2006), “Evaluation of water cement ratio of hardened concrete by x-ray CT method”, Advances in X-ray Tomography for Geomaterials, 443-449.