
Synchrotron X-ray Micro-Tomography and Geological CO2 Sequestration
ABSTRACT. We used beamline 8.3.2 of the Advanced Light Source at Lawrence Berkeley National Lab to gain insights into processes important to the geological sequestration of CO2. Beamline 8.3.2 is a dedicated hard x-ray CT beamline with a superbend magnet source that provides a monochromatic beam in the 8 to 45 keV range. Synchrotron based x-ray CT has several unique capabilities including a tuneable coherent x-ray source which allows for multi-energy chemically sensitive imaging. Data from 8.3.2 were analyzed using a novel Maximal Inscribed Sphere (MIS) algorithm in order to predict the distribution of CO2 within a multi-phase system. In addition, time lapse imaging was used to characterize microbially driven precipitation events.
1. Introduction
Understanding and modeling processes in the subsurface requires an accurate understanding of the three dimensional structure of solid media and how that structure changes with time. Because x-ray CT can provide structural information without disrupting or destroying the matrix, it is an ideal tool for parameterizing and verifying models and for studying dynamic precipitation/dissolution processes. Unlike most lab-based tomographic instruments, in synchrotron tomography the x-ray source usually has very high flux and is monochromatic, tuneable, and largely coherent. This provides for several useful capabilities including phase contrast imaging and chemically sensitive imaging.
With the growing concern over the climate impacts of atmospheric CO2 has come increasing interest in carbon capture and storage (CCS) technologies. Geologic carbon storage involves injection of CO2 into an appropriate subsurface formation such that the injected CO2 will be stable for time frames of thousands to tens of thousands of years. Effectively injecting large quantities of CO2 necessitates a thorough understanding of and the ability to predict the movement of CO2 within porous media. In addition, carbon stored in the form of solid carbonates (e.g. calcite) is impervious to borehole or seal failure hence techniques. Mineralization also significantly modifies rock permeability and mechanical properties by clogging pore throats and strengthening grain-to-grain contacts; these alterations make understanding the 3D distribution and morphology of carbonate precipitation crucial when attempting to predict or enhance the long-term behaviour of CO2 storage units.
Below, we highlight two examples of how synchrotron x-ray tomography can help improve our understanding of these processes. First, we demonstrate the use of a novel algorithm for analyzing tomographic data in order to predict the distribution of CO2 within a two phase CO2/brine system. Second, we use time lapse imaging to dynamically characterize microbially-mediated precipitation in a porous medium.
2. Description of beamline 8.3.2
The x-ray micro-tomography facility is based at beamline 8.3.2 at the Advanced Light Source, Berkeley, California. The setup is similar to the standard setup for this technique developed in the 1990’s (Kinney et al., 1992). The x-rays are produced from a superbend magnet source and pass through a monochromator comprised of two multilayer mirrors, which can be altered in angle to select the required x-ray energy. X-rays of energy 8 KeV to 45 KeV are available. The sample is mounted on an air bearing stage that can be positioned in the x-ray beam. The x-rays transmitted through the sample then interact with a CdWO4 single crystal scintillator that fluoresces the shadowgram x-ray image as visible light. This image is then magnified through a choice of microscope objectives and relayed onto a 4008×2672 pixel CCD camera (Cooke PCO 4000). The ccd pixel size is 9 µm, thus with a 10x objective, pixel sizes of 0.9 µm at the sample image can be mapped onto the ccd. The samples are rotated in the x-ray beam from angles 0 to 180 degrees in the desired increment. A typical scan takes about 20-40 minutes. Samples are generally scanned in absorption mode and the reconstructed images obtained following normalization and the application of a filtered back projection algorithm.
2.1. Multi-energy imaging
The ability to image using monochromatic x-ray beans of different energies can be exploited to introduce a degree of chemical sensitivity into the imaging process. This process is presented here as a general beamline capability but is applicable to the issues of precipitate identification has discussed in the CaCO3 precipitation section below. In this example MoS2 coated SiO2 sand was chosen as a test material because MoS2 is known to form thin coatings similar to those expected from surface precipitation.
Figure 1. Images taken at 19,500 eV (left) and 20,500 eV (right). Graph shows trace across Mo containing grain showing FHWM of ∼4 microns. (The observable ring artefacts result either from non-linearities in beamline optics or imperfections in the reconstruction algorithm. No further attempt was made to remove them because they did not interfere with the desired analysis).
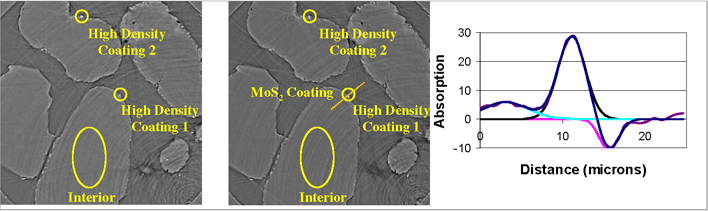
Figure 1 shows two slices from the same region of the MoS2 coated SiO2 sample. One image was taken at 19,500 eV, ∼500 eV below the Mo K edge. The other was taken at 20,500 eV, ∼500 eV above the Mo K edge. There regions within the image were analyzed for changes as a function of energy: the interior of a grain and two “high density” regions on grain surfaces. The change in calculated linear attenuation coefficient between the two energies was undetectable for the grain interior as expected. The first “high density” coating showed a 75% increase in attenuation coefficient at higher energy indicating that this feature contains Mo. The second high density coating feature showed a 22% decrease in attenuation coefficient over the same energy shift indicating that while in any single image these two features appear similar, using multi-energy imaging they can be distinguished as they have distinctly different compositions.
3. Imaging of Frio sandstone
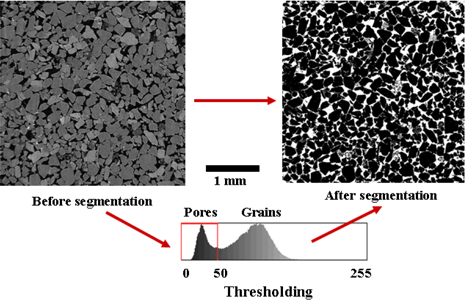
Figure 2 shows a single slice from a set of tomographic images collected from a sample of Frio sandstone. The imaged was processed via a simple threshold segmentation in order to separate the grains from the pore space.
Figure 2. CT image before and after threshold segmentation with histogram of voxel values showing selection of threshold value
3.1. Maximal inscribed spheres calculation
The maximal inscribed sphere calculation is a method for determining the morphological properties of the rock directly from a 3D image data set (Silin, et al, 2006). The method is also suitable for characterization of the geometry and connectivity of the pore structure in a solid material in terms of “pore bodies” and “pore throats”. The algorithm works by assigning each voxel within the data set the radius associated with the “maximal inscribed sphere” as shown schematically in Figure 3.
3.2. Simulation of CO2 distribution in Frio sandstone
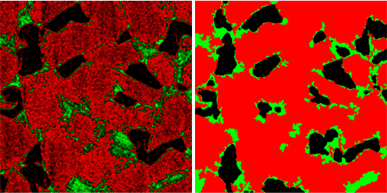
Once each voxel in the data set has been assigned an appropriate radius according to the MIS calculation, this information can be used to calculate physical properties such as capillary pressure curves and fluid distribution. The distribution of two immiscible fluids is calculated by comparing the MIS assigned radius of a given voxel to the theoretical radius of curvature at the interface of the two fluids at a give pressure. Those voxels with radii larger than the theoretical value are assigned to the non-wetting phase, with the balance of the pore space being assigned to the wetting phase. Figure 4 compares the calculated distribution of CO2 and brine within the assumed water wet sandstone sample compared with the distribution as imaged by microtomography. The similarity of the two images can be quantified with the Hausdorff distance (Huttenlocher et al., 1993). Analysis shows that 80% of gas-occupied voxels of the microtomography image are within a 50-voxel Hausdorff neighborhood of the computed gas voxel clusters. (Silin et al., 2009).
Figure 3. Conceptual drawing of sphere assignment in maximal inscribed sphere (MIS) calculation
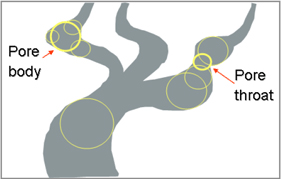
Figure 4. Comparison of CT image (left) and MIS calculated (right) distribution of rock (red), brine (green), and CO2 (black) distribution within a slice of Frio sandstone (adapted from Silin et al., 2008)
4. Imaging of CaCO3 precipitation
Microbial enhancement is one possible approach to increasing carbonate precipitation rates and has additional applications in both environmental remediation and geotechnical contexts (Cunningham et al., 2009). To facilitate these studies, we have developed a family of flow-through bioreactors which can be scanned continuously during precipitation experiments or accurately remounted if longer incubation periods are required for slowly growing cultures.
Bacterial hydrolysis of urea results in the production of ammonium and carbonate ions and an increase in pH, which favors carbonate precipitation if appropriate metal cations (e.g. Ca2+) are available. A first series of tests (Ajo-Franklin et al., 2008) were performed on natural aquifer samples from a site at Idaho National Laboratory (INL). During these studies we scanned wet-packed samples in the bioreactor after equilibration with site groundwater. This step was followed by removal of the reactor from the beamline, injection of 5 mg/L molasses, and then 2 weeks of injection with 10 mM urea dissolved in groundwater to promote calcite precipitation.
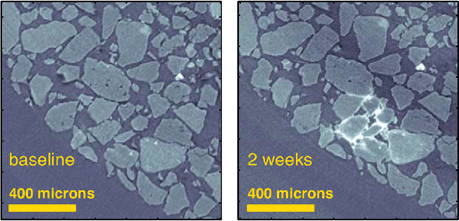
After the urea injection was completed, the bioreactor was remounted in the beamline and scanned a second time. Figure 5 shows x-ray attenuation images of the same vertical slice at baseline and after 2 weeks of stimulation; high density precipitate is visible at grain boundaries in a localized patch. Due to lack of chemical sensitivity the identity of the newly formed precipitate can not be uniquely assigned. However, based on a drop in effluent Ca2+ concentration from 1.1 to 0.8 mM during urea injection in concurrent macro-column experiments, it is likely that the precipitate is CaCO3. Interestingly, precipitation in this case took the form of a small number of dense patches rather than throughout the sample, a geometry which has less impact on flow and mechanical properties than uniform dissemination across narrow pore-throats.
Figure 5. Images show an example of microbial mineralization within a loose granular sample from the INL site. (Flow rate is 2ml/day perpendicular to the page toward the reader)
5. Conclusions
Our initial studies indicate that synchrotron micro-tomography will be a powerful tool for monitoring mineralization processes relevant to CO2 sequestration. Future investigations will integrate bioreactors capable of sustaining higher pressures with a wide range of secondary sensors for measuring electrical and mechanical properties in addition to 3D structure on the micron scale. In addition, multi-energy imaging focused on identifying Sr containing precipitates as a proxy for CaCO3 will be used to support chemical identification of newly formed precipitates. Similarly, micro-tomography data in combination with MIS calculation analysis has been shown to be a reliable approach for understanding the behavior of liquid CO2 within a multi-phase system. In combination, these two approaches will help to address the knowledge gaps that must be bridged in order for geological sequestration of CO2 to make an important contribution to the world’s energy future.
6. Acknowledgements
The authors would like to thank James Nasaitka for his tremendously valuable assistance with the in situ reaction cell. The use of the ALS is supported by the Director, Office of Science, Office of Basic Energy Sciences, of the U.S. Department of Energy under Contract No. DE-AC02-05CH11231. We also thank Office of Science, Office of Biological and Environmental Research for support of the Sustainable Systems: Science Focus Area at LBL. Lastly, we appreciate the support of the Research Partnership to Secure Energy for America, RPSEA.
7. References
Ajo-Franklin J., Hubbard S.S., Wu Y., Nico P., “Using Synchrotron Micro-CT To Monitor Microbially-Induced Calcite Precipitation on the Pore Scale”, AGU Biogeophysics Chapman Conference, Portland, ME, Oct 13-16, 2008
Cunningham A.B., Gerlach R., Spangler L., and Mitchell A.C., “Microbially enhanced geologic containment of sequestered supercritical CO2”, Energy Procedia, vol. 1 no. 1, 2009, p. 3245-3252
Huttenlocher, D.P., Klanderman, G.A., Rucklidge, W.J., “Compariong images using the Hausdorff Distance”, IEEE Transactions on Pattern Analysis and Machine Intelligence, vol. 15, 1993, p. 85-863.
Kinney J.H., Nichols M.C., “X-Ray Tomographic Microscopy (Xtm) Using Synchrotron Radiation”, Annual Review of Materials Science, vol. 22, 1992, p. 121-152.
Silin D., Patzek T., “Pore space morphology analysis using maximal inscribed spheres”, Physica A, vol. 371, 2006, p. 336-360.
Silin D., Tomutsa L., Benson S M., Patzek T W., “Pore-Scale Analysis of Microtomography Images of the Rock in Geosequestration Research”, Eos Trans. AGU, vol. 89 no. 53, Fall Meet. Suppl., Abstract H12C-07
Silin D., Tomutsa L., Benson S M., Patzek T W., “Microscale imaging and Pore-Scale Modeling of Two-Phase Fluid Distribution”, In Review, 2009.