
Deformation in Fractured Argillaceous Rock under Seepage Flow Using X-ray CT and Digital Image Correlation
ABSTRACT. Argillaceous rock is a candidate for radioactive waste storage because of its extremely low permeability. However, during excavation of storage galleries, drilling can induce fractures that may modify (generally increase) the rock permeability. On the other hand, it is thought that stress redistribution after drilling and fluid seepage through time can lead to, at least partial, closure of these fractures. A number of studies reported previously have evaluated the changes in sealing capacity of these fractured argillaceous rocks, but such studies are mostly limited to 2D experiments or numerical modeling, and there are relatively few studies that consider the 3D behavior. The purpose of this paper is to evaluate, using x-ray computed tomography and 3D-volumetric Digital Image Correlation (DIC), the 3D deformation distribution in specimens of fractured argillaceous rock experiencing seepage flow. To achieve this, x-ray tomography images have been acquired of fractured rock specimens at several different stages of seepage flow experiments and 3D-DIC has been applied to evaluate the 3D displacement and strain fields. With these results, the deformation processes due to seepage flow is investigated quantitatively, including for example swelling of the clay matrix around the fracture. This new insight will lead to better understanding of the likely in-situ changes in sealing capacity of the fractured argillaceous rocks in waste storage sites.
KEYWORDS: fractured clay rocks, digital image correlation, swelling, seepage flow, x-ray
1. Introduction
Argillaceous rock is a candidate for radioactive waste storage because of its extremely low permeability. However, during excavation of storage galleries, drilling can induce fractures that called Excavation Damaged Zone, in which the originally low permeability of the host rock may be modified locally by the development of strain localization. On the other hand, it is thought that stress redistribution after drilling and fluid seepage through time can lead to, at least partial, closure of these fractures (Davy et al., 2007). After backfilling and closure of the storage, stress redistributions are shown to re-confine surface cracks and permeability decreases. To understand the deformation of the host rock due to excavation and seepage flow, it is necessary to investigate strain localization in argillaceous rocks.
The purpose of this study is to evaluate, using x-ray computed tomography and 3D-volumetric digital image correlation (DIC), the 3D deformation distribution in specimens of fractured argillaceous rock experiencing seepage flow. To achieve this, X-ray tomography images have been acquired of fractured rock specimens at several different stages of seepage flow experiments and 3D-DIC has been applied to evaluate the 3D displacement and strain quantitatively, including for example swelling of the clay matrix around the fracture.
2. Materials and methods
2.1. Tested material
The argillaceous rock tested in this study was provided by ANDRA (Agence Nationale pour la Gestion des Déchets Radioactifs) from their underground research laboratory site located at Bure (Meuse/Haute Marne, Eastern France) at approximately 550 m below the ground surface. The material has a compressive strength ranging from 20 to 30 MPa. Its water content is about 6%, clay content is in range from 40 to 45% and the other materials are calcite and quartz.
Cylindrical specimens with 10 mm in diameter and 20 mm height were prepared by cutting from the core by diamond wire saw in order to minimize the material disturbance during preparation (Lenoir et al., 2007).
A fracture parallel to the axis of the samples is created by modified Brazilian test which loads the specimen by compression between two parallel. The fracture is kept open by plastic spacers between the halves of the specimen as shown in Figure 1.
Figure 1. Schematic view of the specimen in a PVC tube
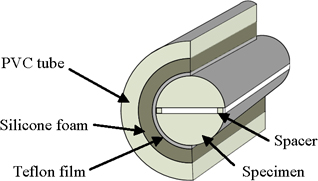
Table 1. Specifications of micro focus X-ray CT in Laboratoire 3S-R
| X-ray generator | ||
| Type | Microfocus enclosed tube | |
| Tube voltage adjustable range | 40kV to 150 kV | |
| Anode current adjustable range | 0µA to 500µA | |
| Maximum power | 75W | |
| Focal spot size | ||
| Small spot mode | 7µm (10W) or 5µm (4W) | |
| Medium spot mode | 20µm (30W) | |
| Large spot mode | 50µm (75W) | |
| Beam open angle | 43° | |
| Position of the focal point | 17mm behind the output window | |
| Output window material | Beryllium (200µm thick) | |
| Detector | ||
| Type | X-ray flat panel detector | |
| Matrix size | 1920 × 1536 pixels2 | |
| Field of view | 195.07 × 243.84 mm2 | |
| frame rate | 0.2 to 30 frame per second | |
| Data type | 14bit gray levels | |
2.2. Experimental procedure
The experiments described here were carried out using microscopic x-ray CT scanner at Laboratoire 3S-R in Grenoble. In this system, a microfocus x-ray source is used to achieve high spatial resolution. Table 1 gives some detailed information about the scanner. The x-ray source was operated at 130 µA of current and at energy level of 75 kV. A set of acquisition data was corrected by recording 1,200 radiographs at different angles equally spaced on 360°. The approximate time for each scan was 6.0 seconds. The actual size of reconstructed domain was 13 × 13 × 13 µm3.
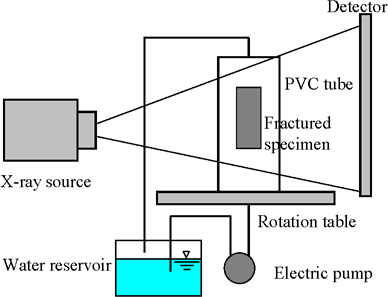
The schematic diagram of the experiment is shown in Figure 2. The apparatus includes a small PVC tube and an electric pump and a reservoir tank. The specimen was wrapped with Teflon film and both ends of the specimen were covered with grease to avoid the contact of the seepage flow with any part of the specimen except the fracture. It was then inserted into a tube of silicone foam. Deionized (pure) water was used for seepage flow and the electric motor allows making constant flow rate in the value of 5 ml min−1. The experiment was conducted in the following procedure. The first tomographic scan was made for initial conditions. Fluid seepage was then run for 6 h, followed by flow stoppage for a second scan (about 3 hours of acquisition). Fluid seepage was run again for 3 h, and last scan was conducted.
Figure 2. Schematic view of the experiment setup
2.3. Image analysis
Digital Image Correlation (DIC, hereafter), in this context, is a mathematical method that finds the displacement of a set of points between two consecutive digital images taken during a deformation process. The volumetric DIC analysis presented in this study was carried out using the code TomoWarp developed at Laboratoire 3S-R (see Hall et al., 2009 for details). This DIC analysis involves the following steps: (1) definition of nodes and the correlation window centered on each node over the reference image; (2) calculation of a correlation coefficient over the correlation window for a series of displaced positions in the second image; (3) definition of the discrete displacement (integer number of voxels), given by the displacement with the best correlation; (4) sub-pixel refinement (because the displacements are rarely integer numbers of voxels); (5) calculation of the strains based on the derived displacements and a continuum assumption.
3. Results and discussions
3.1. Direct observation from CT images
Figure 3 shows the reconstruction of a CT slice perpendicular to the specimen’s axis for each scanning step. The spacers placed in the main fracture are difficult to see because of their low X-ray absorption coefficient. As shown in this figure, secondary cracks have opened after 6 h of seepage flow. These cracks most likely already existed before the seepage and were opened by swelling effect of the material. In contrast, a few secondary cracks were closed during the seepage (Figure 3(b) and (c)). And also it is realized that the main fracture is partially closed in its centre position. Figure 4 shows the vertical slices of the sample. The re-closing the cracks can be observed from these figures.
Figure 3. Horizontal CT slices: (a) initial condition; (b) after 6h of seepage flow; (c) after 9h of seepage flow
Figure 4. Vertical CT slices: (a) initial condition; (b) after 6h of seepage flow; (c) after 9h of seepage flow
Table 2. Results of geometric measurements
Geometric measurements were carried out based on reconstructed slices as shown in Table 2. The measurements were made with thresholded images. The surface of the solid part in the slice orthogonal to the axis of the specimen (Figure 3) increased by 5.8% after 6 hours of flow and 7.6% after 9 hours. The total volume of specimen increases of 6% after 6 hours and 10% after 9 hours. The crack opening at the middle of the specimen decreases by 27% after 6 hours and 48% after 9 hours. It is considered that these results are due to swelling of the material and the opening of secondary cracks.
A simple way to measure the spatial distribution of the swelling would be to evaluate the grey level in CT slices. However this density change is too low to be significant. On the other hand, 3D-DIC provides a full displacement and deformation field for the pair of images as shown in the next section.
3.2. 3D-DIC results
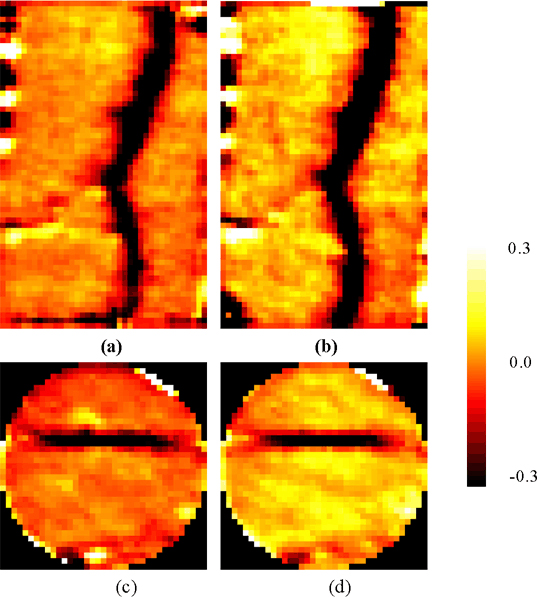
Figure 5 (a) and (b) show the incremental volumetric strain field in a vertical slice through the specimen. The maximum strain plotted in these figures equals 0.3. In the increment from initial to after 6 hours of seepage flow (Figure 5 (a)), the development of dilatant volumetric strain (swelling in the bulk) can be observed in top-left half of the specimen (yellow). Also swelling can be observed around the secondary open cracks. The red fringes (compaction) around fractures are most probably DIC artefacts due to crack edge displacements.
The horizontal cut (Figure 5(c)) shows that the swelling starts from the edges of the main fractures (yellow spot above the crack). In the same cut, the contracting volumetric strain recorded at the ends of the fracture appears due to deformation of the spacer piles rather than of rock itself. In the increment from 6 hours to 9 hours seepage flow, Figure 5(b) and (d) show that swelling in the specimen starts developing extensively not only in the edge of the fracture but also inside the specimen.
These incremental volumetric strain fields suggest that the argillaceous rocks start swelling after only a few hours of water injection and then it develops extensively to inside the material. This means that micro-crack self healing has extremely rapid kinetics, which is an important factor to understand sealing capacity of the fractured argillaceous rocks.
Figure 5. Incremental volumetric strain (a) in vertical cut from initial to 6 h; (b) in vertical cut from 6 h to 9 h; (c) in horizontal cut from initial to 6 h; (c) in horizontal cut from 6 h to 9 h
4. Conclusions
The deformation in fractured argillaceous rock under seepage flow was investigated using x-ray CT and digital image correlation. The swelling and secondary crack opening due to seepage flow can be visualized using x-ray CT scanner. It shows that self healing of a micro-crack has extremely rapid kinetics, which is an important factor to understand sealing capacity of the fractured argillaceous rocks in waste storage sites.
Future studies should attempt to conduct the tests using different kinds of solutions, for example site water from underground laboratory. Also, the experimental device will be improved to apply normal stress to the crack.
5. References
Davy C. A., Skoczylas F., Barnichon J. D., Lebon P., “Permeability of macro-cracked argillite under confinement: Gas and water testing”, Physics and Chemistry of the Earth, vol.32, 2007, pp.667-680.
Lenoir N., Bornert M., Desrues J., Bésuelle P. and Viggiani G., “Volumetric digital image correlation applied to x-ray microtomography images from triaxial compression tests on argillaceous rock”, STRAIN, vol.43, 2007, pp.193-205.
Hall S.A., Lenoir N., Viggiani G., Desrues J., Bésuelle P., “Strain localisation in sand under triaxial loading: characterisation by x-ray micro tomography and 3D digital image correlation”, Proceedings of Int. Symp. on Computational Geomechanics COMGeo09, Cote d’Azur, France, April 29- May 1st, 2009.
Hall S.A., Bornert M., Desrues J., Pannier Y., Lenoir N., Viggiani, G., Bésuelle, P., “Discrete and continuum analysis of localised deformation in sand using X-ray micro CT and Volumetric Digital Image Correlation”, Géotechnique, 2010, accepted.