
Contributions of X-ray CT to the Characterization of Natural Building Stones and their Disintegration
ABSTRACT. This paper highlights the use of the high resolution scanner at the Center for X-ray Tomography in Ghent, Belgium (UGCT), for the 3D quantitative evaluation of the disintegration of some French natural building stones. Rocks deteriorate when they are exposed to extreme weathering factors such as a combination of water and freeze-thaw cycles or high pressure. The results of those processes can be very diverse: from element migration to crust formation to the origination of micro-cracks. Thanks to its non-destructive character, high resolution computed tomography (CT) turned out to be an excellent monitoring tool as it contributes to the characterization of the internal structure of the natural building stone. X-ray CT also provides a better insight into the micro-structural durability properties of the building stone.
KEYWORDS: characterization, building materials, high resolution x-ray CT scanner, micro-cracks, rock failure
1. Introduction
Many rock types are formed under high temperature and/or high pressure conditions in the upper part of the earth’s crust. Some of these are used as natural building stones for various purposes such as house fronts, floors, roof tiles and street pavements. In most cases they are therefore in a thermodynamically instable condition in the environment where they are used nowadays. Exposure of rocks to new exogenous parameters such as fluctuating temperature, pressure and the presence of water/salt may in some cases lead to their deterioration. Some rock types are more susceptible to weathering processes than others, in which fluctuating environmental factors as well as the endogenous or geological parameters of the stone itself (porosity, fossil content, mineral structure, etc.) play an important role.
In order to evaluate rocks used as building material, several characterization tests (petrographic analysis, determination of the porosity, pressure resistance, etc.) and durability tests (freeze-thaw resistance, thermal shock resistance, etc.) exist. The significance of the latter lies in the predictability of the stone’s weathering behavior or resistance under known external conditions. After the tests, the stone’s new physical properties are evaluated with regard to their initial condition. There is thus a registration of both the initial “fresh” rock’s situation before the test and the final “failed” situation at the end of the test series. The main shortcomings in these traditional durability tests are that these evaluations are mainly based on visual inspection and that there is no quantification of internal micro-structural reorganization. However, these internal micro-structural weathering processes are of great importance to understand the deterioration of the stone in its entirety. Internal quantification of dynamic processes still remains difficult with destructive analysis tools. For that purpose, in this study non-destructive high resolution x-ray CT is combined with image analysis to visualize, characterize and quantify freeze-thaw cycles of the Noyant Fine limestone and pressure test on the Euville, Noyant Fine and Savonnières limestone.
2. Methods and instrumentation
2.1. Outline of the UGCT scanner and scanning conditions
The experiments were carried out at the Center for X-ray Tomography at Ghent University (UGCT, www.ugct.ugent.be). The x-ray tube of this high-resolution scanner is an open-type device with a dual head (Feinfocus®, FXE-160.51), consisting of a transmission head for small samples down to sub-micron scale and a high power directional head for relatively large samples. An open-type scanner offers the important advantage that different add-ons can be applied and different detectors can be used to optimize the scanning conditions. In this study the Varian PaxScan 2520 with a pixel size of 127 µm and a dimension of 1880 × 1496 pixels was used. The freeze-thaw cycle tests on the Noyant Fine limestone are performed with the transmission head and a voltage of 80 kV with a power of 8 W and 100 µA tube current. A thin (550 µm) Al-filter was used to block the low-energetic x-rays to prevent beam hardening. For each scan, 1000 projections were registered over an angle of 360° with a source-detector distance of 890 mm and a source-object distance of 55 mm, resulting in a voxel pitch of around 7.8 µm. For each projection 8 frames were taken with an exposure time of 300 ms. The total period of time for one scan was around 1 hour and 30 minutes.
The scans for the pressure tests on the Noyant Fine, Euville and Savonnières limestone are taken with the same parameters, but with a tube voltage of 110 kV instead of 80 kV and an average of 4 frames for one projection.
2.2. Software
The obtained raw CT data is afterwards processed with the in-house developed reconstruction software Octopus. The projection data is filtered by removing bright and dark spots, normalized and regrouped into sinograms. The latter are used to calculate virtual cross-sections through the object. For 3D visualization, VGStudio Max and VGStudio 2.0 (Volume Graphics) have been used. For details about the 3D quantification UGCT software tool Morpho+, the reader is referred to Vlassenbroeck et al., 2007, Brabant 2009 and Cnudde et al., 2009. Some of the main features of the program concern selecting a volume of interest, dual thresholding of porosity/grains, labeling, distance transform and finally calculation of the equivalent diameter and maximum opening. The latter corresponds to the diameter of the maximum inscribed sphere, while the equivalent diameter refers to the diameter of a sphere with the same volume of the selected pore/grain. In this way, quantitative data is obtained together with the 3D visualization of the changing geological parameters.
2.3. Characterization and durability tests on natural building stones
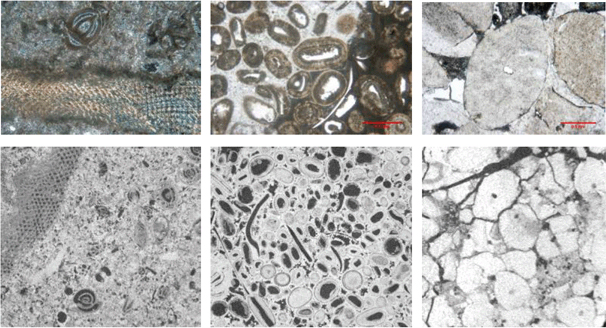
Generally, characterization tests are performed to determine the intrinsic material properties of natural building stones, independent of its future use and environment. The most common characterization test for natural building stones is the use of the petrographic microscope for mineralogical description. As Figure 1 shows, micro-x-ray CT is an excellent complementary technique of petrographic microscopy to visualize, quantify and render the rock’s volume in order to get a deeper insight into its structure. Micro-CT possesses the possibility to calculate porosity and pore interconnectivity in a non-destructive way, parameters that normally are much more difficult to obtain by traditional microscopy. Also pressure tests are applied to characterize natural building stones. In this study an external load is applied on top of the Euville, Noyant Fine and Savonnières limestone samples with a pressure stage until visual deterioration occurred. All samples were cylindrical with a diameter of 8 mm. Afterwards, the deteriorated cores were scanned at the UGCT facility.
Figure 1. Petrographic recording under the petrographic microscope (top row) compared with tomographic slices (bottom row). From left to right Noyant Fine, Savonnières and Euville limestone
Durability tests analyses the behavior of the rock’s intrinsic parameters in function of time. Evaluation of rock stability is based on those tests that are therefore considered as one of the most important to assess natural building stone behavior for the construction industry. Eleven freeze-thaw cycles were carried out on a cylindrical core (diameter 9 mm) of the Noyant Fine limestone. Each cycle consists of an immersion of the sample in water for two hours, followed by storage for 6-7 hours in a cold room at −15°C. After the sample was brought back to room temperature, a high resolution CT scan was made, after which a new freeze-thaw cycle starts. In total 11,000 projections were made, resulting in more than 60 Gbyte of raw projection data.
3. Materials
The Noyant Fine is a Lutetian (Eocene) limestone originating from the north eastern part of the border of the Paris Basin (France). It is composed of numerous Foraminifera and Bryozoa (tiny colonial animal) fragments. The hollow chambers of the Miliolids (a group of foraminiferans) largely contribute to the total rock porosity. The Savonnières and Euville limestone on the other hand have a Late Jurassic age. The former is an oolitic rock with shell fragments. Remarkably most of the ooids (small, spheroidal layered sedimentary grains) have a hollow core. Most of the shell fragments are dissolved leaving behind a secondary or moldic porosity. The Euville limestone on the other hand is composed of large crinoid fragments with a syntaxial overgrowth of calcite.
4. Results and discussion
4.1. Characterization test
The green structures in the three different stone types in Figure 2 correspond with the micro-cracks induced by the pressure test. The pore structure not affected by the micro-cracks (i.e. the “isolated porosity”) is colored red. If a micro-crack affects an interconnected pore network the whole network is considered as being induced by the micro-crack and thus rendered green. Therefore, the term “micro-crack porosity” would be more appropriate. Visualization of both types of pore structures provides an excellent overview of the stones’ internal behavior by increasing external pressure.
Figure 2. Rendered volume of the induced micro-crack porosity (green) and the isolated porosity (red) of the Noyant Fine (a), Savonnières (b) and the Euville (c) limestone
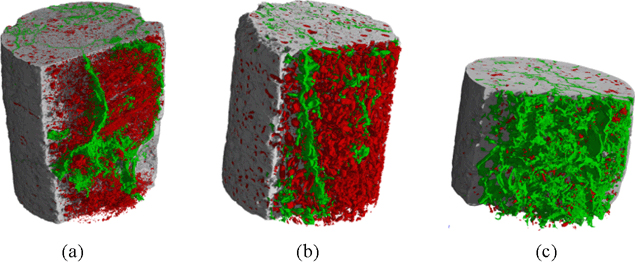
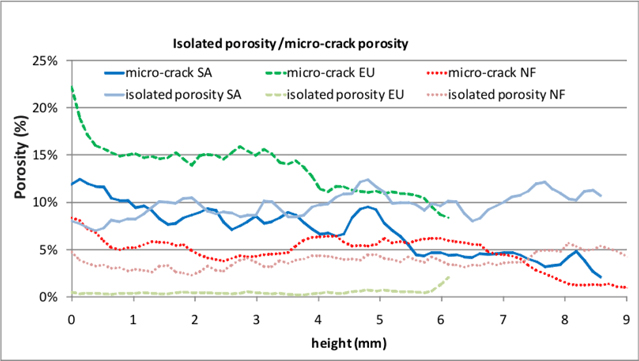
The distinction between the micro-crack porosity and the surrounding but not affected pore structure is obtained on the basis of the ratio of the equivalent diameter to the maximum opening, calculated in Morpho+. The micro-crack porosity will have a large equivalent diameter but a small maximum opening (sphericity << 1), while the pores will be more spherical (sphericity ≤ 1). Besides visualization, the micro-crack porosity and the amount of isolated porosity have also been determined with Morpho+. The micro-crack structure of the Noyant Fine limestone is irregular and amounts to 55% of the total porosity. The crack-structure porosity of the Savonnières stone amounts to 42%. The cracks in the Euville stone amounts to 97% of the total porosity. Figure 3 gives an overview of the ratio between the micro-crack porosity and the isolated porosity for every 10 slices for each stone. For each sample the crack density decreases in function of the height. x-ray CT not only makes it possible to visualize the internal reorganization but also offers the possibility to calculate the ratio of the crack density and the isolated but not affected pore structure.
Figure 3. Trends of induced micro-crack porosity and isolated porosity of the three rocks
4.2. Durability test on the Noyant Fine limestone
Figure 4 shows the deterioration of the Noyant Fine building stone from the 6th till the 11th cycle. After cycle number 7 a micro-crack structure (diameter of approximately 78 µm) appears in the Bryozoa fragment, as clearly can be seen in the figure. After cycle 9 the crack already reached a diameter of around 187 µm and one cycle later it already showed an opening of more than 280 µm. At the end of cycle 11, a part of the stone flakes off. Freeze-thaw tests of the Noyant Fine limestone monitored with high resolution CT have already demonstrated that the crack initiation is located in the micro-porous Bryozoa fragments (Boone 2009). Most of the cycles are fully characterized in 3D with the aid of Morpho+. The total amount of material (fossil fragments, matrix, etc.) with exception of the pores has been calculated before and after the tests by defining the same scan, reconstruction and threshold parameters. It turned out that the material loss after 11 freeze-thaw cycles amounted to around 6.2% of its initial volume, largely attributed to the fragmentation at the end of cycle 11.
Figure 4. 3D visualization of the Noyant Fine limestone after 11 freeze-thaw cycles
5. Conclusion
Some French limestones were used to explore the potential of the technique of high resolution CT for the quantification of the deterioration of building stones and to test and evaluate their durability. With the aid of the in-house built software package Morpho+ it was possible to calculate the percentages of the induced microcrack porosity structure and of the pore structure not affected by the pressure test. After 11 freeze-thaw cycles, the aperture and the evolution of the micro-cracks could been visualized in three dimensions and calculated. The material loss after the last cycle could be evaluated by taking into account constant scan, reconstruction and threshold parameters and also the same volumes of interest. Clearly high-resolution CT combined with image analysis largely contributes to better insight into the characterization and durability assessment of natural building stones. The complex processes of deterioration are recorded in a non-destructive way and finally 4D quantitative data has been obtained.
6. Acknowledgements
The Institute for the Promotion of Innovation by Science and Technology in Flanders, Belgium (IWT) is acknowledged for the PhD grant of J. Dewanckele. The Fund for Scientific Research-Flanders (FWO) is acknowledged for the post-doctoral research grant to V. Cnudde.
7. References
Boone, M.A. 4D-monitoring van fysische verweringsprocessen in carbonaatgesteenten met X-stralen computergestuurde microtomografie (micro-CT), MSc thesis, Ghent University, Belgium, 2009.
Brabant, L. Geavanceerde algoritmes voor 3D-analyse van micro-CT data, MSc thesis, Ghent University, Belgium, 2009.
Cnudde, V., Vlassenbroeck, J., De Witte, J., Brabant, L., Boone, M.N., Dewanckele, J., Van Hoorebeke, L., Jacobs, P. “Latest developments in 3D analysis of geomaterials by Morpho+.” GeoX2010 conference (submitted).
Vlassenbroeck, J., Dierick, M., Masschaele, B., Cnudde, V., Van Hoorebeke, L., Jacobs, P. “Software tools for quantification of X-ray microtomography at the UGCT”, Nuclear Instruments and Methods in Physics Research Section A: Accelerators, Spectrometers, Detectors and Associated Equipment, vol. 580, no. 1, p. 442-445, 2007.