
3D Aggregate Evaluation Using Laser and X-ray Scanning
ABSTRACT. In this paper, two scanning systems, an x-ray-based and a laser-based system, have been evaluated in terms of its capability in accurately acquiring three-dimensional (3D) surface data and their potential in evaluating fine and coarse aggregates. The dimension measurements, surface area and volume quantification capability of the two systems was evaluated through comparing these measurements with caliper measurements, theoretical calculations and other proved methods. The evaluations indicate that both the x-ray scanning method and laser scanning method can yield very high resolution up to 6 to 60 µm in determining the dimensions of aggregates, allowing for accurate characterization of the derived characteristics of aggregate shape, angularity and texture in true 3D.
KEYWORDS: aggregate characterization, laser system, x-ray system, 3D evaluation, shape, angularity, texture of aggregates
1. Introduction
Aggregates are an important component in asphalt concrete, cement concrete, granular base and treated base. Their characteristics including shape, angularity, surface texture and surface area significantly affect the properties of mixtures (Masad and Button 2000; Rao et al., 2001; Garboczi et al., 2002; Wang et al., 2004a). Historically, tremendous efforts have been made to quantify these characteristics both directly and indirectly and correlate them to performance. Research using 3D mapping for aggregate evaluation is very limited and so far, only a few published results are available (Kim et al., 2002; Wang et al., 2003; Wang et al., 2004b). Most published results have significant limitations in the true 3D sense: mapping (reconstructing) the 3D coordinates of the surface points of an aggregate particle. Most methods only map partial surfaces of the particle. The methods using laser scanning and CT differ in their mechanisms of acquiring the 3D data. The presented work focused on the evaluation of the accuracy of laser scanning and x-ray tomography scanning in measuring the dimension, surface area and volume.
2. Laser and x-ray scanning systems for aggregate evaluations
Imaging systems using laser and x-ray are frequently used in mapping three-dimensional (3D) surfaces and volumes. Their primary functions reside in acquiring images of the objects of interest and subsequently processing them with the help of analysis tools. Analysis tools are computer programs used to analyze the acquired images in order to obtain the desired information, such as dimensions, shape, texture or angularity. There are various imaging systems in the laser and x-ray scanning categories. The systems used in this study are briefly described in the following sections.
2.1. Surveyor 3D laser scanner
The laser scanner used in this study utilizes a line-range laser probe (RPS 120), shown in Figure 1, for profile measurement. The probe contains a laser diode that passively spreads the laser into a line and two charge coupled device (CCD) arrays that acquire the inputs for surface point reconstruction. Both CCDs observe the same area known as the field of view (FOV) of the laser. Solid red line (Figure 1, b) shows a calibrated laser (see CD of this volume for color figures).
Figure 1. a) RPS Line range probe and b) probe correction
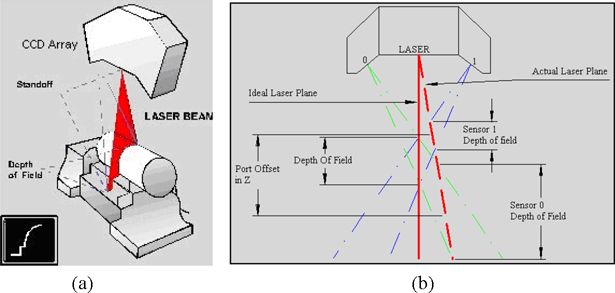
A precise method of 3D data acquisition, laser triangulation, is an active stereoscopic technique where the distance of the object is computed by means of a directional light source and a video camera. A laser beam is deflected from a mirror onto a scanning object that scatters the light, which is then collected by a video camera located at a known triangulation distance from the laser. Using trigonometry, the 3D spatial coordinates of a surface point are calculated.
2.1.1. Image analysis and volumetric reconstruction
Surveyor laser scanners use 3D point cloud conversion to reconstruct scanned objects into accurate surface files. The process of 3D digitization basically consists of a sensing phase followed by a reconstruction phase. The sensing phase collects or captures the raw data that generate the initial geometry data, usually as a 2D boundary object, or a 3D point cloud.
A surveyor laser scanner uses rapid profile sensors (RPS) to acquire and analyze 2D data. Also, 3D digital models of laser scanned objects can be created from 3D digital coordinate point clouds using specialized computer software.
2.2. Skyscan 1174 x-ray micro-CT scanner
The Skyscan 1174 micro-CT scanner uses an x-ray source with adjustable voltage and a range of filters for versatile adaptation to different object densities. Also, a variable magnification (6-30 µm pixel size) is combined with object positioning for easy selection of the part of an object to be scanned. The computed tomography process involves a micro-focus x-ray source which illuminates the object, a planar x-ray detector that collects projection images, and a sample manipulator that rotates and translates a sample. Based on hundreds of angular views acquired while the object rotates, a computer synthesizes a stack of virtual cross-sections or slices through the object. By selecting various volumes of interest, it is possible to measure 3D morphometric parameters and create realistic visual models for virtual travel within the object.
2.2.1. Image analysis and volumetric reconstruction
The Skyscan 1174 micro-CT scanner analyzes the tomographic datasets for 2D and 3D morphometry and densitometry. SkyScan’s volumetric reconstruction software uses a set of acquired angular projections to create a set of cross-section slices through the object. 3D visual models from scanned datasets can be obtained from selected region-of-interest (ROI) and volume-of-interest (VOI) of an object.
3. Data analysis and results
3.1. Aggregate dimensioning
The aggregates used in this project were crushed limestone and granite. Two sets of aggregates, each containing nine particles, ranging from 1 ½in (37.5 mm) to No. 16 (1.18 mm) were measured using three means: electronic calipers with a precision of two decimals, SkyScan 1174 CT Analyzer software and RPS-120 Geomagic software.
Figure 2. Correlation between Skyscan 1174 measurements and RPS-120 measurements
Three dimensions were measured using the above means: length (L) – representing the longest dimension of the particle; width (W) – representing the second longest dimension of the particle normal to the length direction; and height (H) – representing the shortest size of the particle perpendicular to the plane formed by the length and the width. Figure 2 above shows the correlations between Skyscan 1174 analyzer method and the RPS-120 laser method, using linear regression.
3.2. Aggregate surface area and volume evaluation
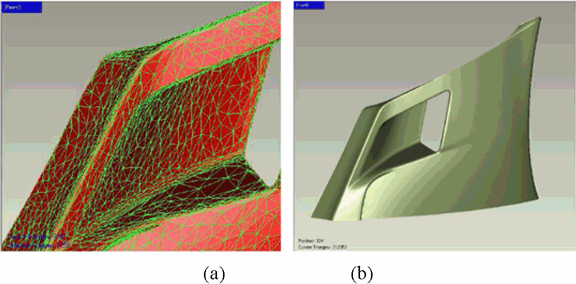
Using the laser triangulation technique (Figure 3, a), point coordinates can be acquired and then be transformed into a single coordinate system. By selecting the model area field in the program the total surface area of the scanned object is computed. Similarly, by selecting all points or polygons that lie within a user-specified bounding box the total volume of a scanned object is calculated (Figure 3, b).
Figure 3. Surface area (a) and volume calculation (b) examples
Morphometric parameters – object surface and volume – are calculated by CT-Analyser either in 2D from cross-section images or region-of-interest (ROI), individually or integrated over a volume-of-interest (VOI). 3D analysis uses the 2D analysis parameters to create surface area of interest and volume of interest analyses. Data of the surface area and volume of the two sets of aggregates acquired with the laser and x-ray CT software programs indicated that the two methods used to compute (a) the surface areas and (b) the volumes were strongly correlated (Figure 4). This indicates that these two methods give very accurate results and both systems can be employed successfully for evaluating mineral aggregates. Also, surface areas and volumes for four regular geometrical objects, a rectangular prism, a cylinder, a sphere, and a pyramid were determined using both systems. For this particular case, the surface areas and volumes obtained using scanners’ software were roughly 4% away of those calculated using mathematical formulas.
Surface area to volume ratios were calculated for both sets of aggregates and for spheres having the same volumes as the aggregates and the results showed good correlations between the specific surface areas of aggregates versus the specific surfaces of spheres with the same volumes. However, slopes for the two aggregate sets were slightly different, indicating minor different morphological characteristics of the two sets of aggregates.
Figure 4. Correlation between CT-Analyser and Geomagic in evaluating the surface area (a) and the volume (b) of aggregate particles
Similarly, strong correlations were obtained between the masses and volumes of the two aggregate sets computed using software from the two scanning devices. The linear relationship obtained indicates that volume measurements using both scanning methods are accurate, assuming an aggregate has a constant density.
4. Conclusions
This study presents a comparison between two different methods, x-ray computed tomography and laser scanning reconstruction – for evaluating fine and coarse aggregate dimensions, surface areas and volumes. Based on the data obtained it can be concluded that the two scanning systems can successfully be used in evaluating mineral aggregates. Both dimensioning computer programs agreed well with the calipers results. Data from the Skyscan 1174 method were slightly larger than those of the RPS-120 laser meaning that the CT Analyzer software is more accurate in dimensioning samples than Geomagic software. Also, good correlations between the Skyscan 1174 CT Analyzer and RPS-120 Geomagic dimensioning values and surface areas and volumes of aggregates were obtained. These evaluations indicated that both scanning methods can be used to assess the derived aggregate characteristics such as shape, angularity and texture.
5. References
Edil, Garboczi, E.J., “Three-dimensional Mathematical Analysis of Particle Shape Using X-ray Tomography and Spherical Harmonics: Application to Aggregates Used in Concrete”, Cement and Concrete Research, vol. 32, no.10, 2002, pp. 1621-1638.
Kim, H.K., Haas C.T., Rauch A.F., and Browne C., “Wavelet-based 3D Descriptors of Aggregate Particles”, presented at 81th Annual Meeting of the Transportation Research Board, Washington, D.C., CD-ROM 2002.
Masad, E. and Button J.W., “Unified Imaging Approach for Measuring Aggregate Angularity and Texture”, Journal of Computer-Aided Civil and Infrastructure Engineering, vol. 15, no. 4, 2000, pp. 273-280.
Rao, C., Tutumluer E., and Stefanski J. A., “Coarse Aggregate Shape and Size Properties Using a New Image Analyzer”, Journal of Testing and Evaluation, JTEVA, vol. 29, no. 5, Sept. 2001, pp. 461-471.
Wang, L.B. and Frost J.D., “Quantification of Aggregate Specific Surface Area Using X-ray Tomography Imaging”, In ASCE Geotechnical Special Publication, E. Tutumluer, Y. Najjar, and E. Masad (eds.), GSP No.123, 2003.
Wang, L.B., Paul H. S., Harman T. and D’Angelo J., “Characterization of Aggregates and Asphalt Concrete using X-ray Tomography”, Journal of the Association of Asphalt Paving Technologists, vol. 73, 2004a, pp. 467-500.
Wang, L.B., Wang X., Mohammad L., and Abadie C., “A Unified Method to Quantify Aggregate Shape Angularity and Texture Using Fourier Analysis”, ASCE Journal of Construction Materials, vol.17, vo.5, 2004b, pp. 498-504.
T.B., “Mechanical Properties and Mass Behavior of Shredded Tire-Soil mixtures”, Proc. of the International Workshop on Lightweight Geo-Materials, JGS, pp. 17-32, 2002.
Humphrey, D.N., Whetten, N., Weaver, J., Recker, K., Cosgrove, T.A., “Tire TDA as Lightweight Fill for Embankments and Retaining Walls”, Proc. of Conference on Recycled Materials in Geotechnical Application, ASCE, pp. 51-65, 1998.
Hazarika, H., Kohama, E., Suzuki, H., Sugano, T., “Enhancement of Earthquake Resistance of Structures using Tire Chips as Compressible Inclusion”, Report of the Port and Airport Research Institute, vol. 45, no. 1, 2006.
Holz, W.G., Gibbs, H. J., “Triaxial shear tests on pervious gravelly soils”, ASCE, vol. 82, no. SM 1, pp. 1-22, 1956.
Hyodo, M., Yamada, S., Orense, R.P., Yamada, S., “Undrained cyclic shear properties of tire chip-sand mixtures”, Scrap Tire Derived Geomaterials, Taylor & Francis, pp. 187-196, 2007.
Kaneda, K., Hazarika, H., Yamazaki, H., “The numerical simulation of earth pressure reduction using tire chips in backfill”, Scrap Tire Derived Geomaterials, Taylor & Francis, pp. 245-251, 2007.