
Minitab contains a couple of methods to create a Gage R&R worksheet. They can be found either in the Stat menu under Quality Tools, or alternatively, with the Assistant Measurement Systems Analysis (MSA) section. Both are very easy to use and generate a worksheet for entering measurements. This can help produce worksheets ready for analysis of the data.
Here, we will create a Gage R&R study for two operators, 10 samples with two replicates on each sample by each operator, using the Create Gage R&R Study Worksheet option in the Stat menu.
The following instructions will create a new worksheet containing Operators and Sample columns ready to run Gage R&R study (Crossed):
- Navigate to Stat | Quality Tools | Gage Study and click on Create Gage R&R Study Worksheet.
- On the top of the dialog box are selections for Number of parts and Number of operators; change Number of Operators to 2.
- In the table of operator, change the name for operator 1 to
Robertand that for operator 2 toHelen. - Click on Options; check the box Store standard run order in worksheet.
- Click on OK in each dialog box to create the worksheet.
The worksheet creation tools are a quick way to generate a worksheet for a Gage R&R study (crossed). The default number of parts is 10, with three operators and two replicates—as suggested by the AIAG guidelines.
Note
The Automotive Industry Action Group (AIAG) develops recommendations and practices of quality and process improvement in the automotive industry. The AIAG publish a series of manuals governing standards for the use of techniques and tools for quality.
Although primarily concerned with the automotive industry, they are frequently cited in other industries as well.
Even though the suggested number of samples in the study is 10, it can be useful to increase the number of parts in the study if we do not know the historical variation of the process. The higher the number of samples collected, the better the estimate of the population variation of the samples will be.
Here, we chose to store the standard run order in the worksheet. The StdOrder column shows the default, unrandomized order the design is generated in. The RunOrder column shows the randomized order we are requested to run the design in.
By default, the RunOrder column is randomized for the sequence of parts within operators. We could change this to randomize the entire worksheet or the operator sequence.
As Minitab prefers working with columns, the worksheet is set out for all the results to be entered in a new column at the end of the design. We will name this column and enter the measurements as collected in the random order suggested.
This layout is different to the structure that may be used in Excel or texts on Gage R&R. It may happen that Gage R&R will have a table structure similar to the following screenshot:
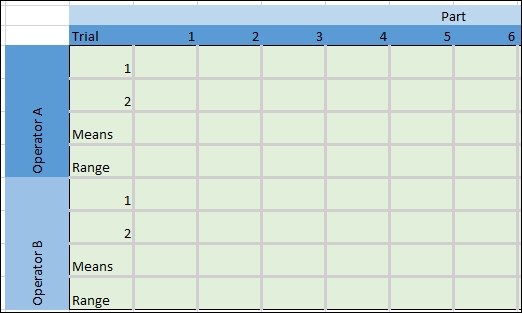
These tables are easy to use for hand calculation and are often entered into Excel in this format. They can be a quick way to work with the mean and range calculations to estimate variation from parts and operators. We will look at an example of converting a Gage R&R table like the one displayed back into a Minitab-preferred format. This is dealt with in the upcoming recipes.